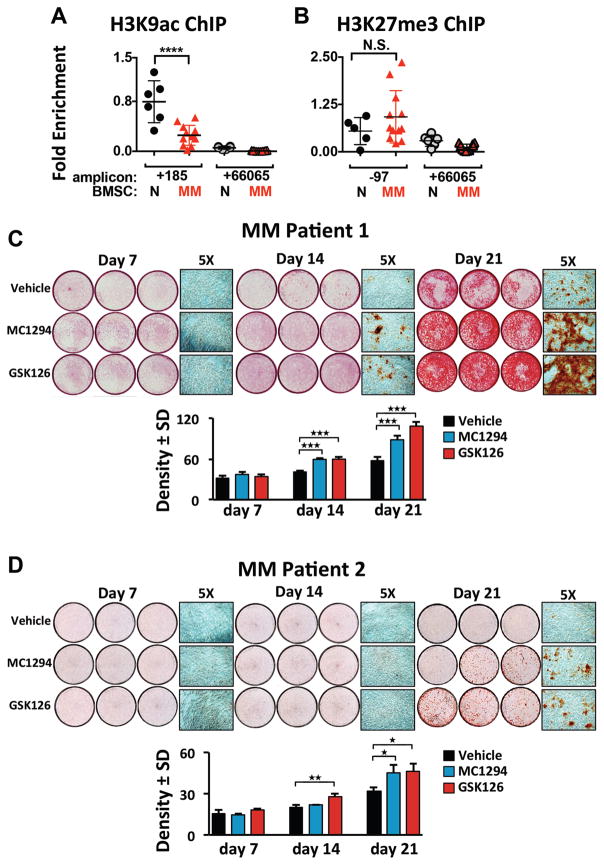
Figure 6. MM-BMSC samples exhibited decreased H3K9Ac at the hRUNX2 promoter compared to HD-BMSC and inhibition of either HDAC1 or EZH2 rescues MM-BMSC OB differentiation.
(A) Anti-H3K9Ac (and IgG) ChIP-qPCR analysis of HD-BMSC (N) (n=6) and MM-BMSC (MM) (n=12, patient characteristics in Table S3) using amplicons +185 and +66065 relative to the hRUNX2 P1 TSS. One anti-H3K9Ac ChIP amplicon +185 N sample result was used as the reference sample for all other data and ΔΔCt shown. (B) Anti-H3K27me3 (and IgG) ChIP-qPCR analysis of HD-BMSC (n=6), which included two donors used in A, and a unique set of MM-BMSC (n=12, patient characteristics in Table S4), using amplicons -97 and +66065 as described in A. There were no significant differences in the IgG pulldown results across all samples and between the amplicons. The significance of differences between N and MM samples for each amplicon were determined by one-way ANOVA with Tukey’s multiple comparison post-test using Graphpad Prism 6. (C, D) MM-BMSC from two different patients (Table S5) were cultured 7, 14, or 21 days in osteogenic media supplemented with vehicle, MC1294 (10 μM) or GSK126 (2.5 μM); the inhibitors were absent d14–21. Mineralization was assessed using Alizarin Red staining. Three independent wells from each treatment group are shown as well as a representative 5X magnification. Below each set is the density quantitation for the average of 6 wells/condition with SEM and significance indicated.

