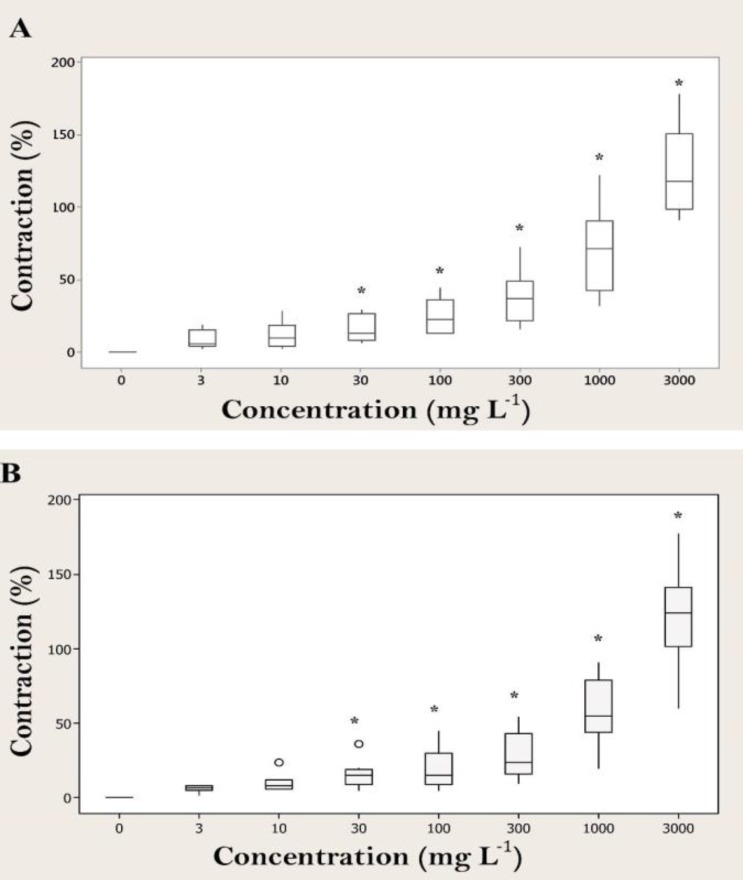
Fig. 1.
Box plots for effects of A. millefolium aqueous extract (n = 8) (A) and hydroalcoholic extract (n = 8) (B) on basal tonus of healthy cattle abomasal preparations. Each box represents the central 50% of the values, the horizontal line within each box represents the median value, and the whiskers indicate the range of values that are within the inner boundary. Values outside the inner fence are plotted as empty circles (o).
٭ indicates significant differences compared to control (p < 0.05).

