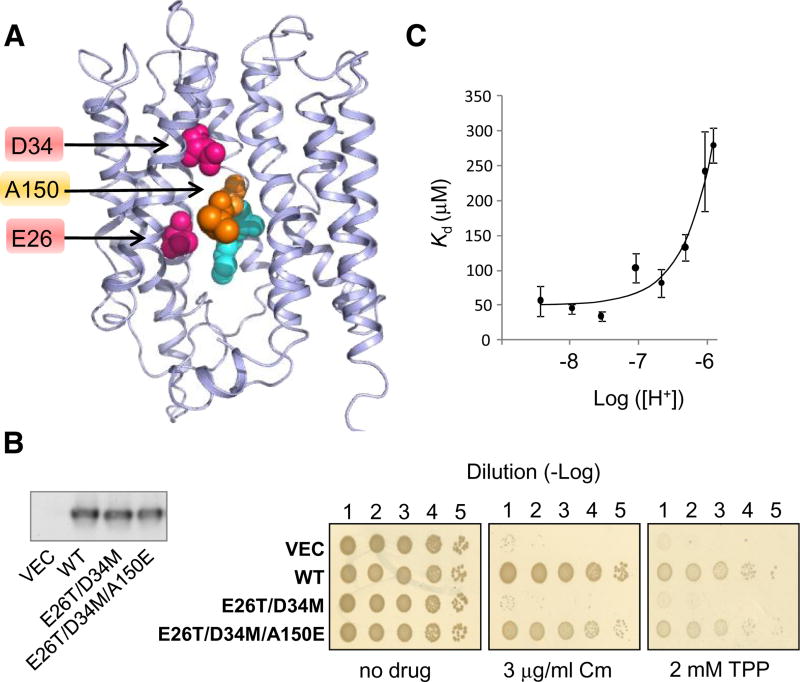
Figure 4. Rescue of MdfA(E26T/D34M) by A150E.
(A). Selected residues viewed on the 3D–structural model of MdfA. The studied residues are indicated by an arrow. M146 and A147 are colored cyan and teal, respectively.
(B) Drug resistance of E. coli cells harboring the indicated MdfA mutant (or empty vector) (See Figure 3E). Chloramphenicol = Cm. Left panel: Western blotting analysis shows that the expression of the various MdfA mutants is comparable.
(C) Affinity of MdfA(A128C) harboring the triple mutation E26T/D34M/A150E for TPP. The lines represent a nonlinear regression fit to an equation describing competitive binding between substrates and protons. The experiment was repeated three times and the error bars represent SD. See also Figure S3.

