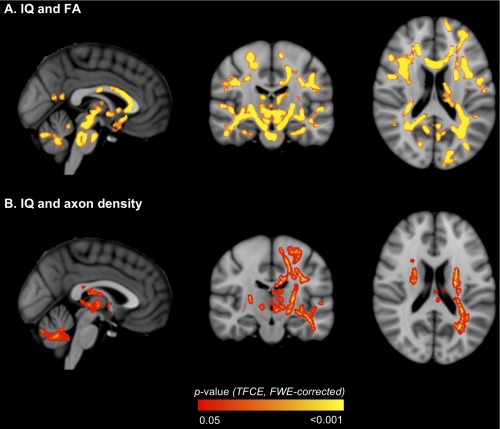
Figure 5.

Regions where white matter diffusion values [A. fractional anisotropy (FA); B. axon density] in very preterm children correlated with IQ. The P‐value images, displayed in red‐yellow, have been thickened for visualization and overlaid on the standard space (MNI152) T 1‐weighted image. Only P < 0.05, after threshold‐free cluster enhancement (TFCE) and correction for the family‐wise error rate (FWE), are shown. [Color figure can be viewed in the online issue, which is available at http://wileyonlinelibrary.com.]
