
Fig. 1.
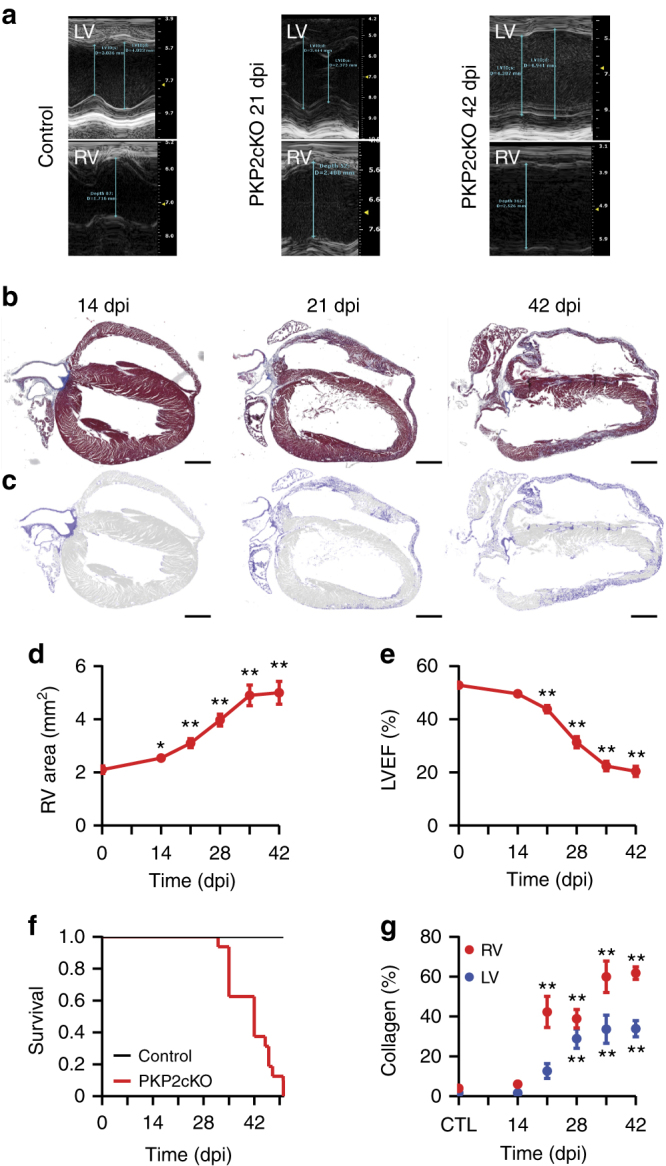
Progression of cardiomyopathy in PKP2-cKO mice. a Representative images of M-mode echocardiography recorded from left ventricle and right ventricle (LV; RV) of PKP2-cKO mice before (control; left), 21 dpi (middle) and 42 dpi (right). Notice scales on the right of each panel. b Masson’s trichrome staining of longitudinal heart sections of PKP2-cKO hearts at 14, 21, and 42 dpi (left, middle and right panels, respectively). c High contrast mask of the same sections emphasizing collagen deposition in the RV and LV in blue. Scale bar = 1 mm for all images. d Time course of change in RV area (measured by modified long axis B-mode echocardiography) in PKP2-cKO mice as a function of days after tamoxifen injection (dpi). Number of animals: n = 21 (0 dpi); n = 12 (14 dpi); n = 18 (21 dpi), n = 16 (28 dpi); n = 11 (35 dpi); n = 9 (42 dpi). e LV ejection fraction (LVEF) in PKP2-cKO, measured by long axis B-mode echocardiography. Number of animals: n = 21 (0 dpi), n = 13 (14 dpi), n = 19 (21 dpi), n = 16 (28 dpi), n = 15 (35 dpi), and n = 10 (42 dpi). For d, e, we obtained repeated measures from the same animals; statistical significance was calculated by paired Student’s t-test, comparing each value against its own control. f Kaplan–Meier survival curve of PKP2-cKO and control mice as a function of days after tamoxifen injection. A total of 16 PKP2-cKO and 10 control animals were followed. g Quantification of collagen deposition in the right (RV, red dots) and in the left (LV, blue dots) ventricle of control (CTL, n = 7) and PKP2-cKO hearts at 14 dpi (n = 5), 21 dpi (n = 10), 28 dpi (n = 8), 35 dpi (n = 8) and 42 dpi (n = 9). Statistical significance by one way ANOVA, RV and LV compared independently against corresponding control. For d, e, g: *p < 0.05, **p < 0.001