
Fig. 3.
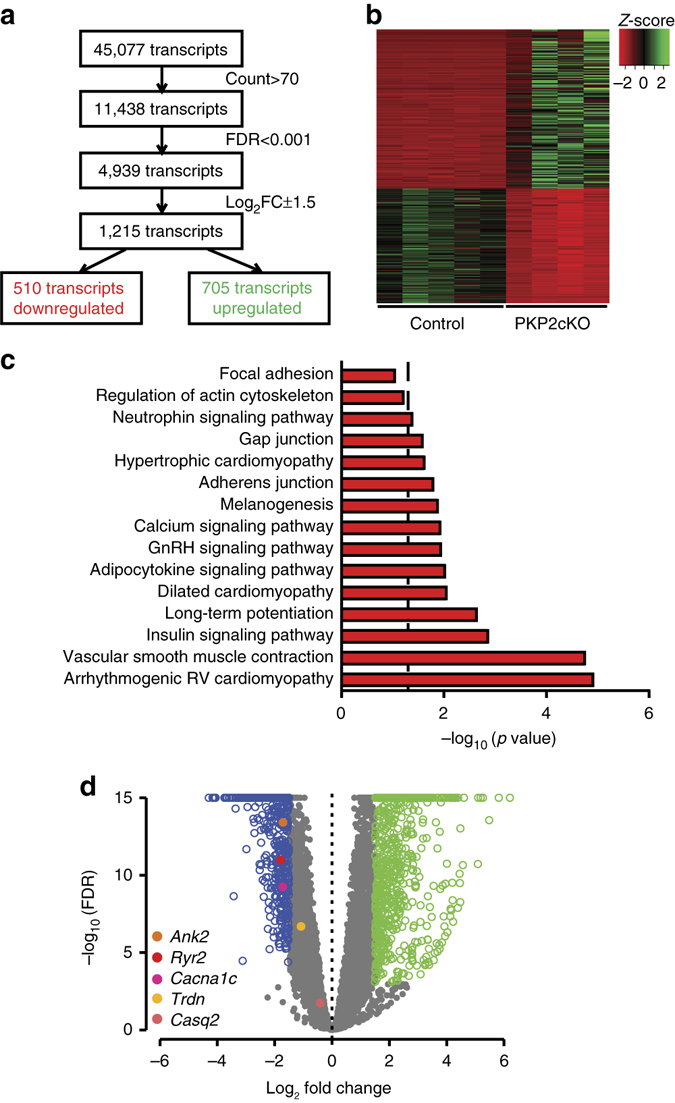
Transcriptome analysis in PKP2-cKO and control mice. a Flowchart of RNA-Seq analysis. b Heatmap of transcripts from control and PKP2-cKO hearts at 21 dpi (n = 5 and n = 4, respectively) highlighting consistency within groups. Red and green: downregulated and upregulated transcripts, respectively. c Significantly enriched KEGG (Kyoto Encyclopedia Genes and Genomes) categories show differentially downregulated gene pathways in PKP2-cKO hearts. d Volcano plot of upregulated (green) or downregulated (blue) transcripts in PKP2-cKO hearts as per inclusion criteria noted in a. Dots in gray: transcripts meeting exclusion criteria. Dots in other colors: specific transcripts noted in bottom left of plot