
Fig. 4.
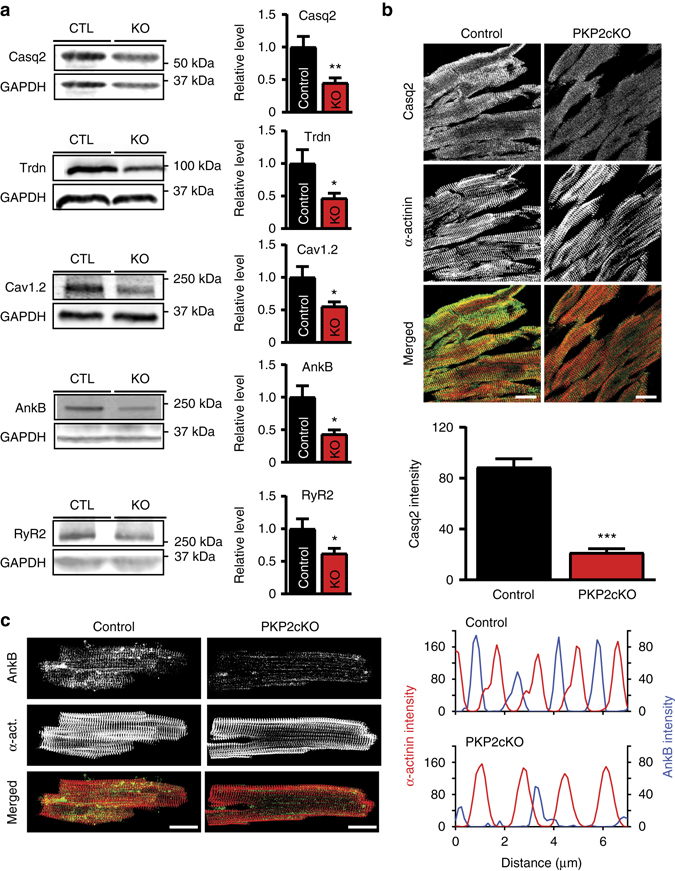
Remodeling of proteins involved in calcium signaling pathways in the PKP2-cKO mouse. a Representative western blots (left) and average densitometry (right; n = 6 for all groups) measured from control (CTL) and PKP2-cKO (KO) ventricular lysates. *p < 0.05; **p < 0.01 (Student’s t-test). b Immunofluorescence staining for Casq2 (green) and α-actinin (red) in control and PKP2-cKO ventricular sections collected at 21 dpi. Scale bar = 20 µm. Bottom panel: quantification of Casq2 intensity in PKP2-cKO vs. control samples. Analysis from 54 images, obtained from four hearts, both for PKP2cKo and control. ***p < 0.001 vs. control. c Immunofluorescence staining for Ankyrin B (green) and α-actinin (red) in control and PKP2-cKO heart sections at 21 dpi. Scale bar, 20 µm. Right panel: profile expression intensity of AnkB and α-actinin in PKP2-cKO and control hearts