
Fig. 5.
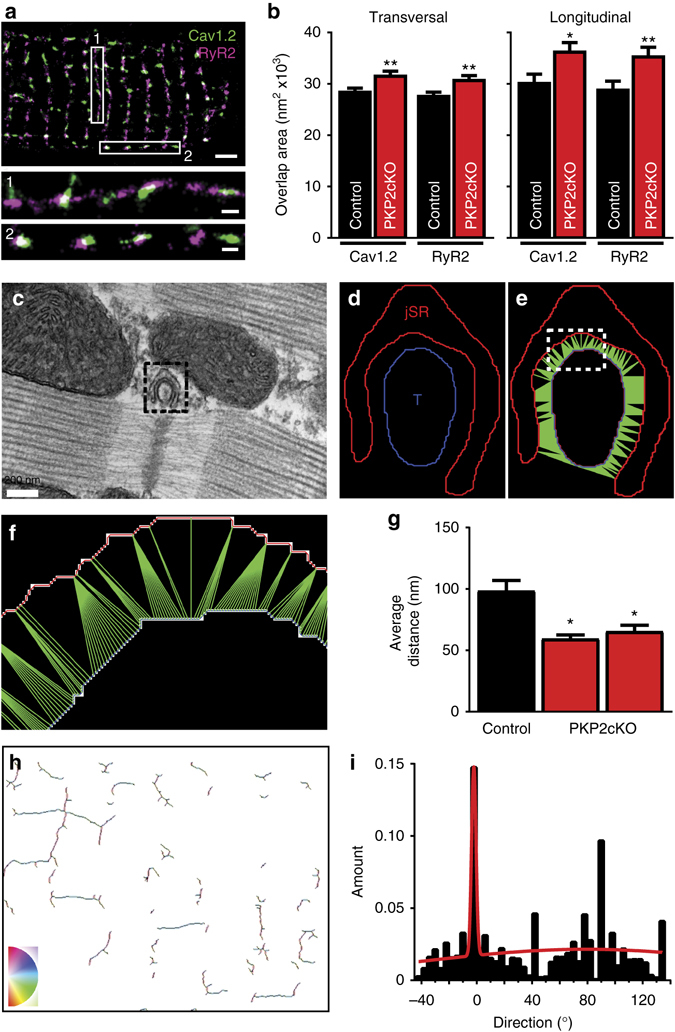
Structural changes consequent to PKP2 deletion. a STORM-acquired images of Cav1.2 (green) and RyR2 (purple) in a single myocyte. b Analysis of RyR2/Cav1.2 overlapping area in transverse (left) and longitudinal (right) clusters. n = 1335 and 1285 clusters from 30 control and 25 PKP2-cKO cardiomyocytes at 21 dpi, respectively. t-test, *p < 0.05 and **p < 0.01 vs. control. c 2D-EM image of PKP2-cKO ventricular tissue at 21 dpi showing a dyadic structure. Scale bar = 200 nm. d Boundaries of the jSR (red) and T-tubule (blue) membranes, detected from the dyad in the dotted square in c. e Acquisition of distances from each point in the T-tuble membrane to its closest neighbor in the jSR (green lines). f Close-up of the region inside the dashed square in e. All distances measured within a dyad were averaged to obtain the “average distance” for that dyad (expressed in nm). g Comparison of average data collected from one control (n = 30 dyads) and 2 PKP2-cKO 21 dpi samples (n = 41 dyads for both). Student’s t-test *p < 0.001 vs. control. h Spatial orientation of the T-tubular network, obtained from segmentation and analysis of a volume of 15 × 12 × 0.8 µm3 dimensions obtained by Serial Block-Face Scanning Electron Microscopy analysis. See also Supplementary Video 1 and “Methods”. The angle of the T-tubular skeleton is color-coded (bottom left) from −90° in magenta to +90° in red; relative to the longitudinal axis of the cell (light blue; 0°). i Histogram of orientations (from h), showing a strong preference for zero-degree orientation, as expected from a non-failing heart (see ref. 60)