
Fig. 6.
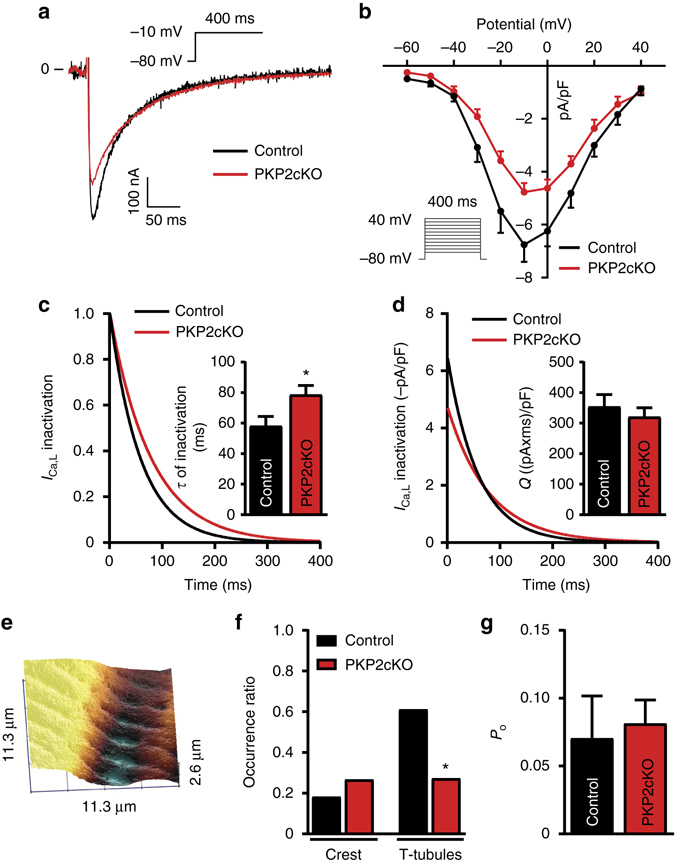
Calcium current in PKP2-cKO cardiomyocytes at 21 dpi. a L-type calcium current in control (black) and PKP2-cKO (red). b Peak L-type calcium current density as a function of voltage recorded in control (black) and PKP2-cKO (red) cardiomyocytes. Voltage clamp protocol in inset. c Normalized L-type calcium current decay in control (black) and PKP2-cKO (red) cardiomyocytes. Inset: Tau of inactivation of the L-type calcium current in control (black) and PKP2-cKO (red) cardiomyocytes. Student’s t-test, *p < 0.05 vs. control. d L-type calcium current decay in control (black) and PKP2-cKO (red) cardiomyocytes. Inset: Charge (Q) passing through calcium channels during L-type calcium current in control (black) and PKP2cKO (red) cardiomyocytes. For b, c and d, results collected from 13 cells, three mice in the control group and 10 cells, three mice in the PKP2-cKO group. e Example of SICM recording showing crest and T-tubules. f Occurrence ratio of calcium channels at crest and T-tubules measured by SICM in control (n = 11 and 18 for crest and T-tubules respectively; black) and PKP2-cKO (n = 15 and 22 for crest and T-tubules respectively; red) cardiomyocytes. Five mice in each group. χ 2 test, *p < 0.05 vs. control. g Calcium channel unitary conductance in control (n = 5; black) and PKP2-cKO (n = 5; red) cardiomyocytes. Five mice in each group