
Fig. 8.
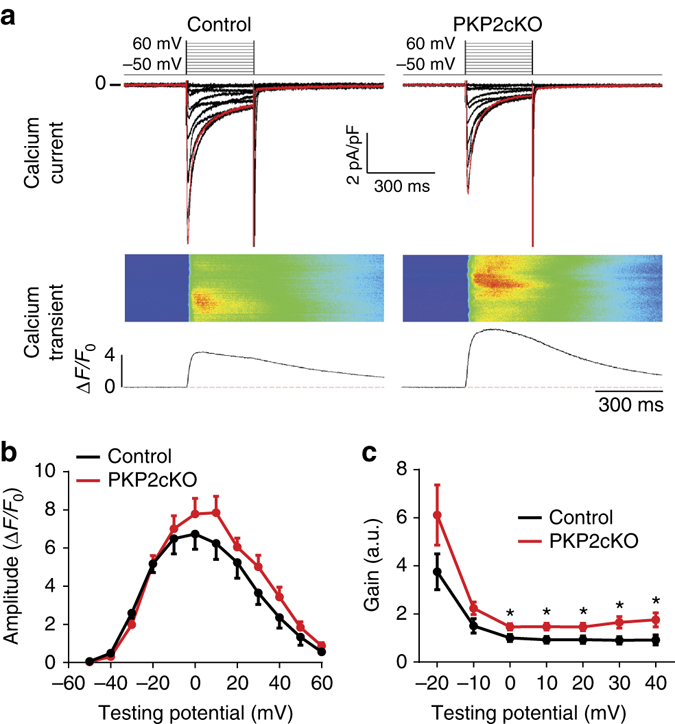
Excitation–contraction (e–c) coupling gain. a Representative examples of excitation–contraction coupling gain measurement in WT (left) and KO (right) cells. Cells were voltage-clamped at −50 mV, and depolarized from −40 mV to +60 mV for 300 ms in 10 mV increments. Red traces in top panels correspond to the current triggered by the 0 mV voltage pulse (top). Ca2+ transients were recorded simultaneously with L-type Ca2+ currents (middle). Fluorescence intensities were plotted from the Ca2+ images (bottom). b Amplitude of Ca2+ i transients in control and PKP2-cKO cardiomyocytes. c e–c coupling gain, calculated as the ratio of [Ca2+]i transient amplitude (ΔF/F 0) vs. I CaL density (pA/pF), was significantly higher for PKP2-cKO cardiomyocytes, especially at positive test potentials. (Control: n = 10 from two mice; PKP2-cKO: n = 11 from three mice; *p < 0.05 vs. control by Student’s t-test)