
Fig. 9.
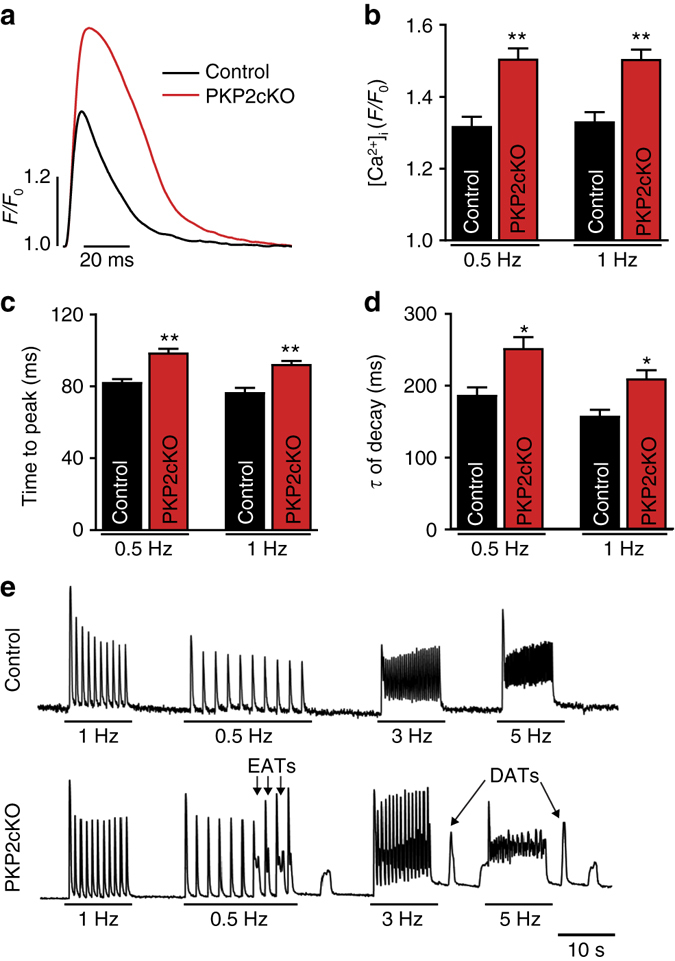
Ca2+ transients in PKP2-cKO cardiomyocytes at 21 dpi. a Ca2+ transients from control (black) and PKP2-cKO (red) cardiomyocytes paced at 1 Hz. b–d Quantification of time to peak (b), amplitude (c) and relaxation time constant (d) of calcium transients from ventricular myocytes paced at 0.5 and 1 Hz from control (n = 26; three mice) and PKP2-cKO (n = 50; three mice) cardiomyocytes. Student’s t-test, *p < 0.05, **p < 0.01 vs. control. e Examples of Ca2+transients in control (top) and PKP2-cKO cardiomyocytes (bottom) with different pacing rates (0.5–1–3–5 Hz). Both early after-transients (EATs) and delayed after-transients (DATs) were recorded