Fig. 2.

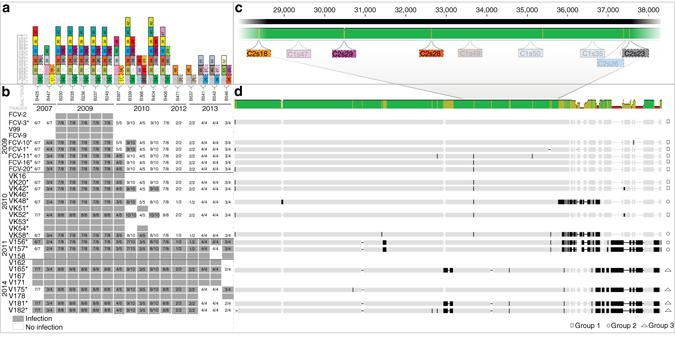
Arms race coevolution of phage infectivity and host resistance at genetic level. The effect of long-term genomic coevolution on phage infectivity and genome, and on host bacterium CRISPR content. a Spacer diversity in the variable ends of both CRISPR loci (C1 and C2) is indicated by numbered and colored rectangles above each bacterial strain (each number and color referring to a specific spacer within a locus). C1 spacers are marked with solid lines (left spacer column) and C2 spacers with dotted lines (right spacer column). Numbers and colors are locus-specific and only variable spacers are shown. All spacers except C1s32, C1s38, and C2s15 are targeting the phages. b Host range of phages (rows) infecting Flavobacterium columnare isolates (columns). Gray rectangles indicate infection (presence of plaques) and white rectangles indicate resistance. The first number within these rectangles indicates the number of CRISPR spacers with an identical match in the phage genome and the second number the maximum number of phage-targeting spacers the bacterium has. c Close-up: CRISPR protospacer regions mapped to a ~11 kb portion of the multiple sequence alignment, where the four highlighted protospacers indicate specific, possibly CRISPR-driven, changes in these areas. d Patterns of molecular evolution in the phage genomes in response to host range. Each sequenced phage genome follows the corresponding host range row from b. Green color in the consensus sequence (above) indicates identical sequence, yellow 30%, and red < 30% identity. Note that also the bar height changes accordingly. Black indicates nucleotide differences and insertion elements
