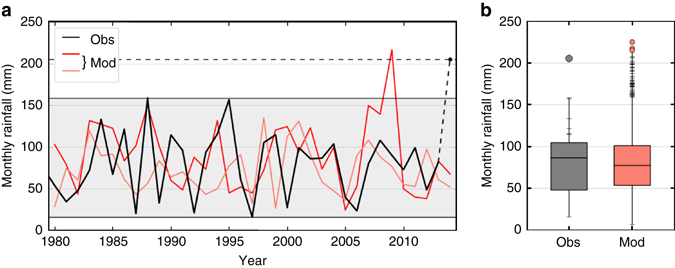
Fig. 1.

Unprecedented monthly rainfall. a South east England January monthly rainfall totals from 1979 to 2014, in mm (black) and two examples from model simulations (red). The black dashed line indicates the unprecedented January 2014 observed rainfall total. b Distribution of south east England January monthly rainfall totals from observations (grey) and the model (red). The box represents the interquartile range and the range of the whiskers represents the minimum and maximum monthly rainfall totals. The grey dot indicates the record observed monthly rainfall of January 2014 and ticks on the upper end of observations show the values in the upper quartile of previous events. Ticks on the model line indicate months above the observed record prior to 2014, and red dots indicate even higher totals
