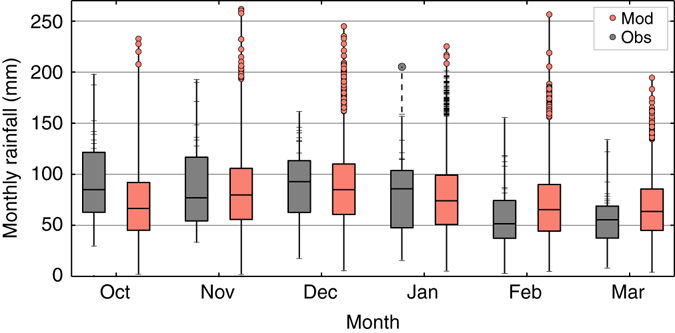
Fig. 3.

Unprecedented monthly rainfall in all winter months. South east England monthly rainfall totals from observations (grey) and the model (red) for October to March. The box represents the interquartile range and the range of the whiskers represents the minimum and maximum monthly rainfall totals. Red dots indicate model months with greater total rainfall than has yet been observed and ticks on the upper observations line indicate values in the upper quartile of events. For January the ticks on the model line indicate months above the observed record prior to 2014 and the grey dot above the observations indicates the record observed monthly rainfall of January 2014
