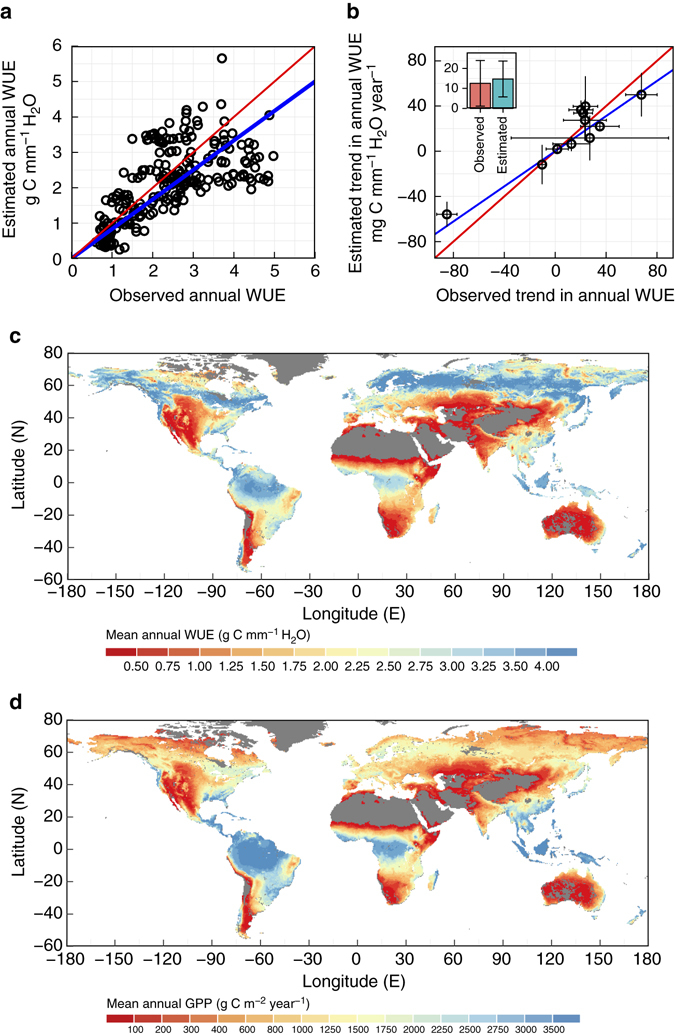
Fig. 1.

Validation of the ecosystem water use efficiency (WUE) model and spatial variability of estimated mean annual WUE and gross primary production (GPP) over the period of 1982–2011. a Validation of annual WUE in g C mm−1 H2O using observations from 51 eddy covariance flux sites (n = 229 site-years). The red line is the 1:1 line and blue line is fitted using least square regression. b Validation of the trends in annual WUE in mg C mm−1 H2O per year at 11 eddy covariance flux sites with at least 7 years observations. The red line is the 1:1 line. The error bars indicate one standard deviation of estimated and observed trends using different methods. The inset shows the mean of observed and estimated trends of all the 11 stations. c, d Estimated spatial details (0.5° × 0.5°) of the global mean annual ecosystem WUE in g C mm−1 H2O and gross primary production (GPP) in g C m−2 per year, respectively, with bare land coloured in grey
