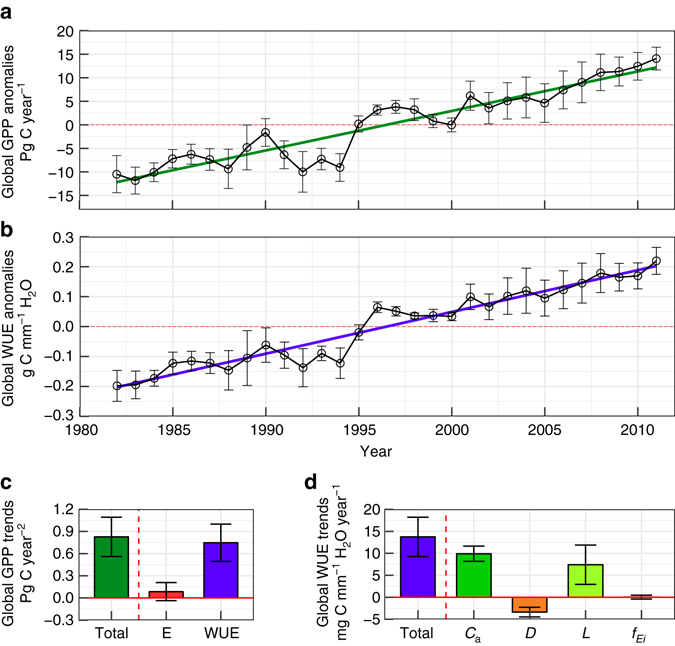
Fig. 2.

Estimated trends in global gross primary production (GPP) and water use efficiency (WUE) and their drivers over 1982–2011. a, b Annual mean anomalies and its standard deviation (shown as error bars) of global GPP in Pg C per year (n = 84) and global WUE in g C mm−1 H2O (n = 12) during 1982–2011, respectively. The green line in a and blue line in b represent the linear trend over the past three decades. c Contribution of E and WUE to total global trends in GPP (Total). d Contributions of four factors to the total increase in global WUE (Total). C a, D, L and refer to contributions from atmospheric CO2 concentration, vapour pressure deficit, leaf area index and fraction of canopy interception to total ecosystem water use, respectively. The error bars in all the subplots represent one standard deviation
