
Fig. 1.
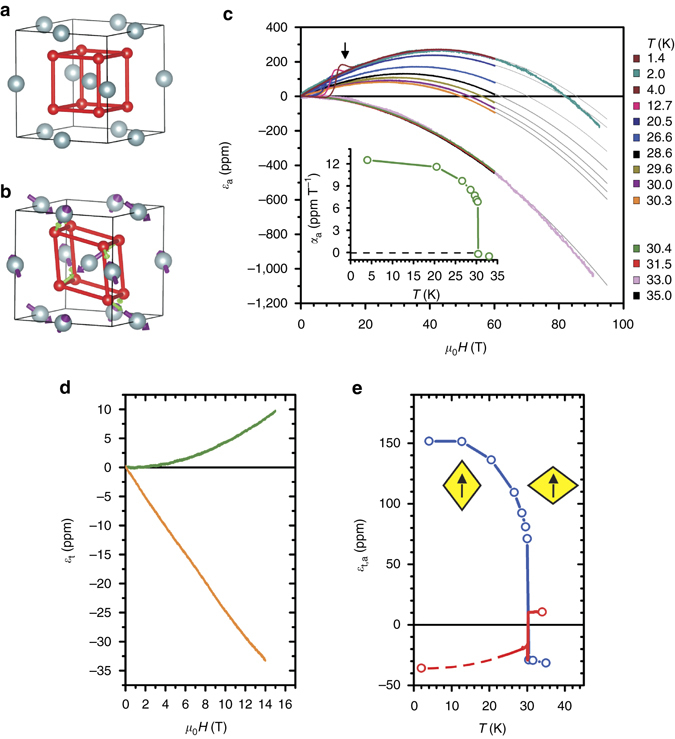
Axial and transverse magnetostriction in UO2. a fcc unit cell of UO2. b The low-temperature antiferromagnetic state displaying the transverse 3-k T A magnetic order (violet arrows) and oxygen displacements (green arrows, not to scale) along the directions. c Isothermal axial strain ε a vs. H parallel to [111] measured in pulsed magnetic fields to 92.5 T at different temperatures listed on the right-hand side. Grey lines are fits to the expression α a H + β a H 2. The jump between the curves for 30.3 and 30.4 K is a consequence of the first-order phase transition. Linear magnetoelastic coefficient α a(T) vs. T (inset). d Isothermal transverse strain ε t vs. H parallel to [111] at T = 2 K (orange) and 34 K (green). e ε a(H = 15 T) (blue) and ε t(H = 15 T) (red) vs. T. This panel shows a field-induced broken fcc symmetry with a different Poisson ratio and an inverted sign in the PM and AFM phases, a consequence of the strong linear term α(T). This is also visualized by yellow rhombuses in the figure. Arrows mark the direction of applied magnetic field. The axial magnetostriction was also measured in the paramagnetic state on a different sample with H parallel to [100], not shown, and found to follow an H 2 field dependence with a magnitude ~5× smaller than along [111]. Indications of irreversibility were found in the magnetostriction data in the AFM state, indicated with an arrow in c