Fig. 3.

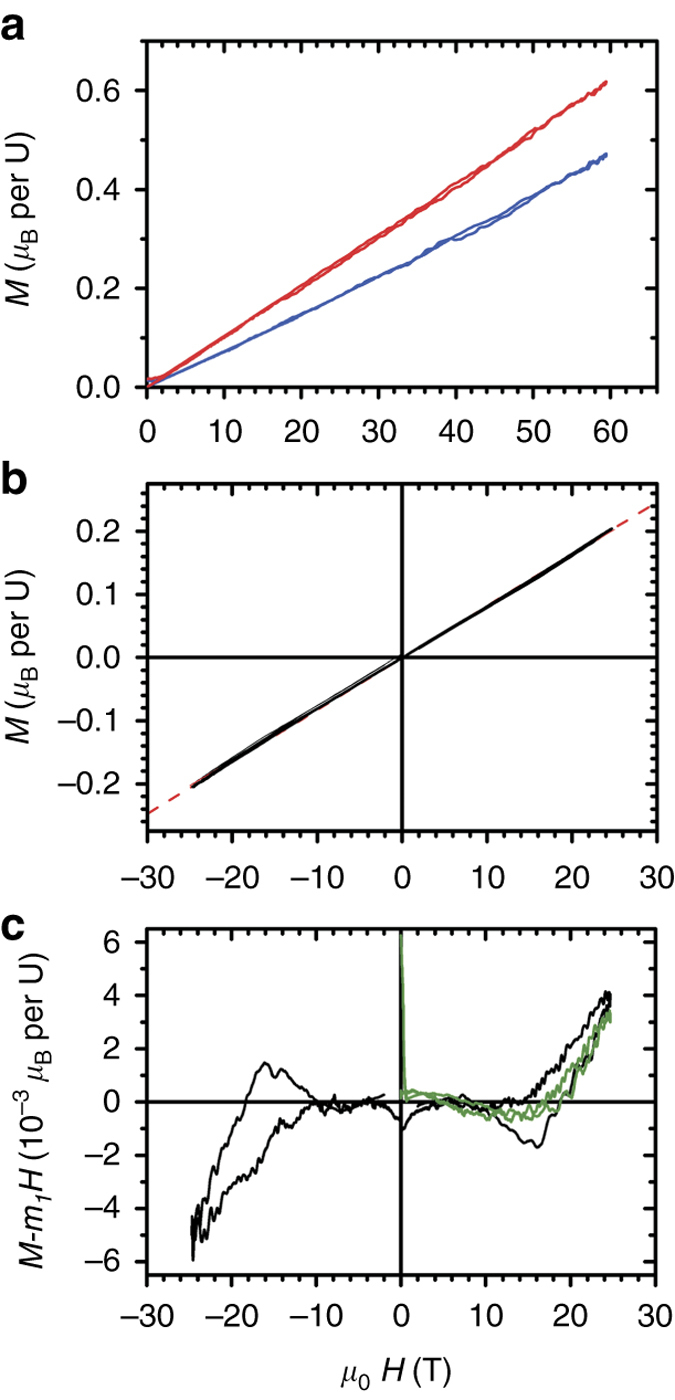
Magnetization versus magnetic field in UO2. a Magnetization M vs. magnetic field μ 0 H measured in a pulsed magnet to 60 T, with H parallel to [111], in the AFM (blue curve, T = 4 K) and paramagnetic (red curve, T = 35 K) states. Besides a reduction in the slope at low temperatures, very little structure is observed. The maximum induced moment is 0.5–0.6 μ B per U. b Magnetization vs. field measured to 20 T (T = 4 K) for both positive and negative magnetic fields. No structure or irreversibility is evident to the naked eye. The red dashed line is a linear fit to the data, with slope m 1 = 7.12 × 10⁻³ μ BT−1 per U. c When a linear contribution is subtracted, some structure becomes apparent. Black lines depict the resultant magnetization on the first field pulse after cooling the sample in zero field in each direction. Green lines depict the data obtained on a second pulse applied in the same direction
