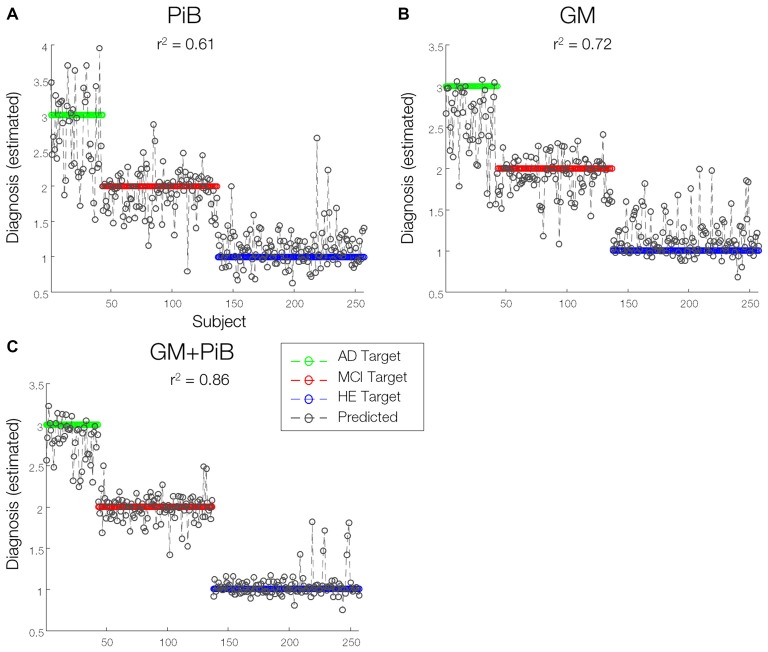
Figure 6.
Predictions of diagnosis of individuals. A line prediction plot (predictions overlaid on targets) of diagnosis values of subjects derived from (A) GMs (B) PiB-PET scans modeled by kernel ridge regression (KRR) method and (C) combined GM-MRI and PiB-PET data modeled by sMKL. Proximity of sample data to any colored horizontal line denotes the likelihood of classifying under that particular diagnostic category associated with that line.

