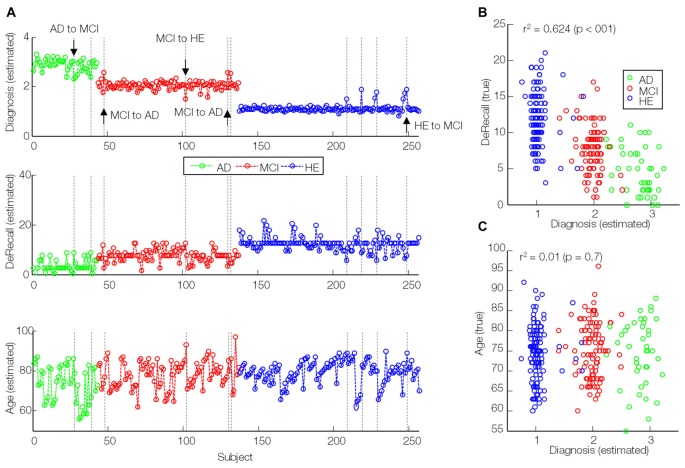
Figure 7.
Correlation of estimated diagnosis values (modeled by sMKL) with true DeRecall scores and age values. (A) Line plots of estimated diagnosis values (similar to Figure 6C), (B) true DeRecall scores and (C) true age values. Dashed lines: outlier (transition candidates) samples. Down/upside arrows: correctly detected transitions.

