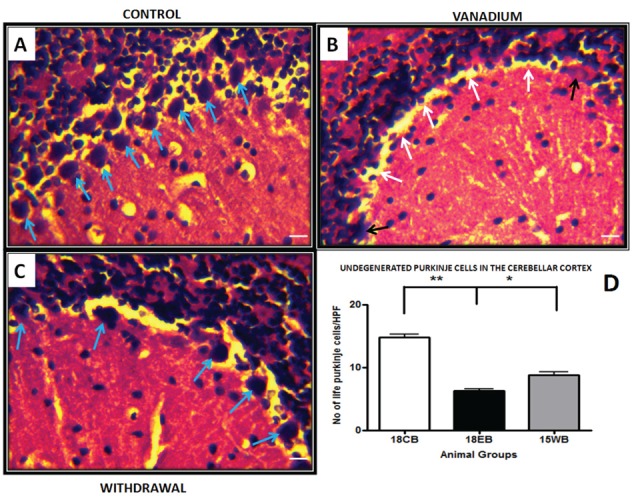
Figure 12.

Haematoxylin and Eosin (H&E) stained sections of cerebellar cortex for control mice (A) and vanadium 18 months exposed mice (B) and age matched withdrawal (C). (A) Shows numerous Purkinje cells (blue arrows) intact in the Purkinje cell layer. The white arrows in (B) shows Purkinje cells detachment and sloughed cells (black arrows) from Purkinje cell layer, the withdrawal groups (C) shows less cell detachment compares with V groups. Quantitative analysis (D) revealed significantly (**P < 0.001) reduced Purkinje cell count in the vanadium exposed group relative to the control, while the withdrawal group count was significantly (*P < 0.05) high relative to vanadium group (D), scale bar 25 μm.
