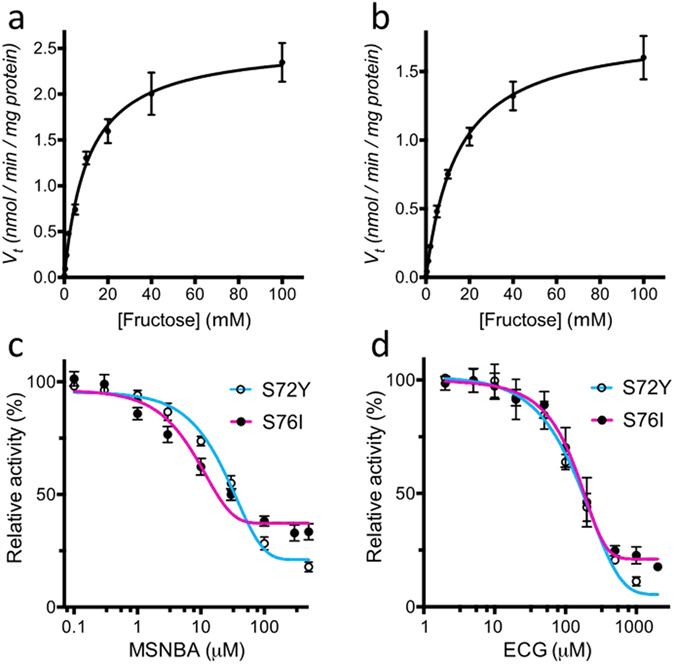
Figure 4.

Transport kinetics and inhibition of GLUT5 mutants in hxt 0 cells. The initial uptake velocity vt (expressed as nmol fructose transported per minute per mg cell dry weight) was measured for GLUT5trS72Y (a) and GLUT5trS76I (b) and plotted against sugar concentration. Mean values and standard deviation were calculated from biological triplicates. The lines represent a least-square fit to the Michaelis-Menten equation. The uptake of fructose was measured at variable MSNBA (c) and ECG (d) concentrations and the uptake velocity was normalized to that in the absence of the inhibitor. The IC50 values were calculated by nonlinear algorithm plots supplied by Prism (GraphPad Software).
