
Figure 3.
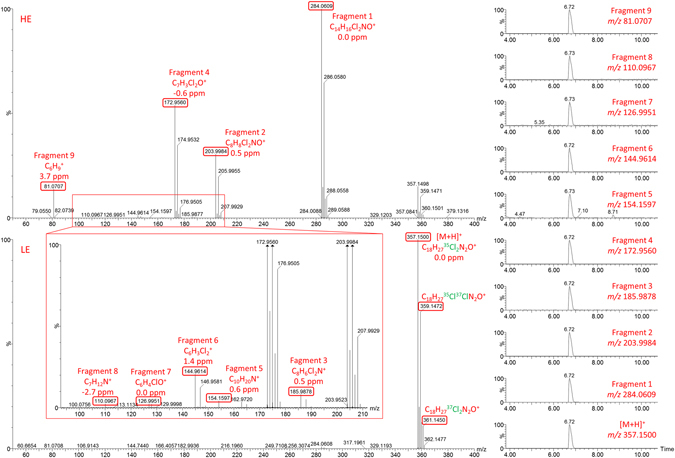
UHPLC-HRMS MSE spectra of the U-49900. Right: Extracted ion chromatograms (EIC) (0.02 Da mass window) for protonated molecule in LE function, and fragment ions in HE function. Left: LE (bottom) and HE (top) spectra of U-49900.
Official websites use .gov
A
.gov website belongs to an official
government organization in the United States.
Secure .gov websites use HTTPS
A lock (
) or https:// means you've safely
connected to the .gov website. Share sensitive
information only on official, secure websites.
UHPLC-HRMS MSE spectra of the U-49900. Right: Extracted ion chromatograms (EIC) (0.02 Da mass window) for protonated molecule in LE function, and fragment ions in HE function. Left: LE (bottom) and HE (top) spectra of U-49900.