Figure 4.

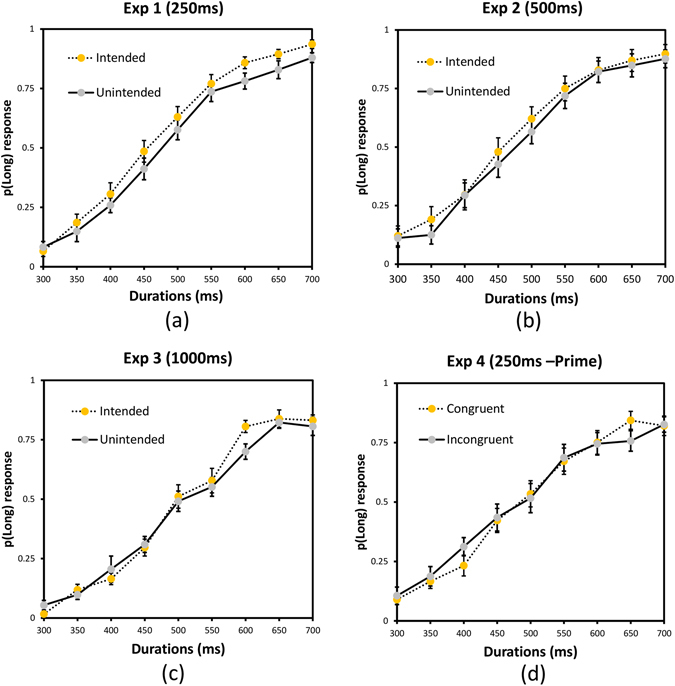
Plots depicting the proportion of long responses and standard error for each stimulus duration for intended and unintended conditions in (a) Exp 1, (b), Exp 2, and (c) Exp 3 as well as congruent and incongruent conditions in (d) Exp 4.

Plots depicting the proportion of long responses and standard error for each stimulus duration for intended and unintended conditions in (a) Exp 1, (b), Exp 2, and (c) Exp 3 as well as congruent and incongruent conditions in (d) Exp 4.