
Figure 3.
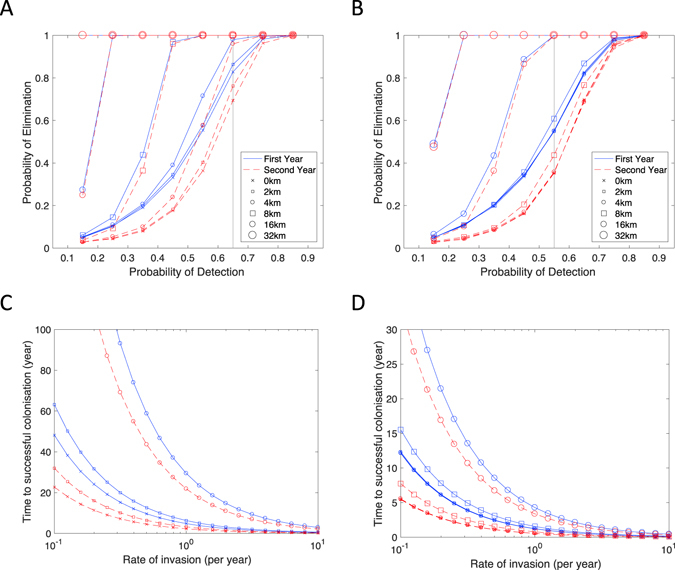
The probability of V. velutina eradication following successive years of nest detection and destruction. All results represent the average over (ten thousand) stochastic replicates and capture full parameter uncertainty. Solid blue lines represent simulations where detection (and destruction) begin in the year of invasion – when there is assumed to be only one active nest; dashed red lines correspond to simulations where the invading nest remained undiscovered in the first year, and probabilistic detection only begins in the second year. Crosses are for simulations without additional radial detection, while open symbols represent differing radii of detection. In (A) we assume that once a nest is probabilistically detected a thorough search of the area will find 99% of all nests within a given radius; in (B) we assume these radial searches only find 48% of nests (comparable to the detection probability in Andernos-les-Bains (Supplementary Material)). In (C) and (D) we investigate the expected time to successful colonisation when the UK is subjected to a constant rate of invasion; detection rates in (C) and (D) correspond to the vertical lines in (A) and (B). Search radii of 8 km or more in (C) and 32 km in (D) lead to permanent exclusion of V. velutina.