
Figure 2.
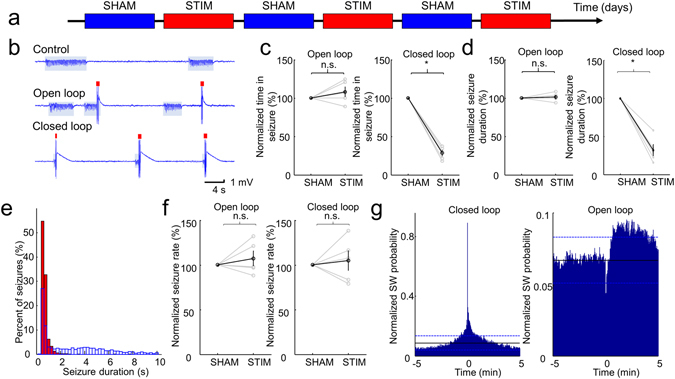
Results of the seizure suppression on the short term. (a) Experimental timeline showing a day-by-day alternation of sham and stimulated sessions. This pattern was repeated for 6 days. (b) Representative examples of LFP traces for the sham, pseudorandom and closed-loop seizure interruption protocols. Shaded bars and red ticks indicate the identified seizures and stimuli, respectively. (c) Time in seizure (normalized to the average seizure duration during the SHAM days for each animal) during SHAM and STIM days. Results from individual rats (grey lines) and group statistics (black lines) are shown. Stimulated day values are normalized to the preceding SHAM days’ values. Error bars represent ± SEM. (d) Average seizure duration (normalized to the average seizure duration during the SHAM days for each animal). Grey lines denote individual animals, while black lines represent the population data. Error bars represent SEM. (e) Representative example of the distribution of seizure durations during SHAM (blue) and STIM (red) days in one animal with closed-loop stimulation. (f) Seizure rates during the SHAM and STIM days (normalized to the average seizure rate during the SHAM days for each animal). Grey lines denote individual animals, while black lines represent the population data. Error bars represent SEM. (g) Peri-stimulus time histogram of the SW-complexes of a closed-loop and an open-loop stimulated rat across all the stimulated days. Black lines denote the average SW occurrence rate along the whole recording period and dashed blue lines refer to the confidence intervals (95%). Reference TES stimulus events are at time 0. *p < 0.01, paired two-sample t-test (c), Wilcoxon rank sum test (d), paired two-sample t-test (f).