
Figure 4.
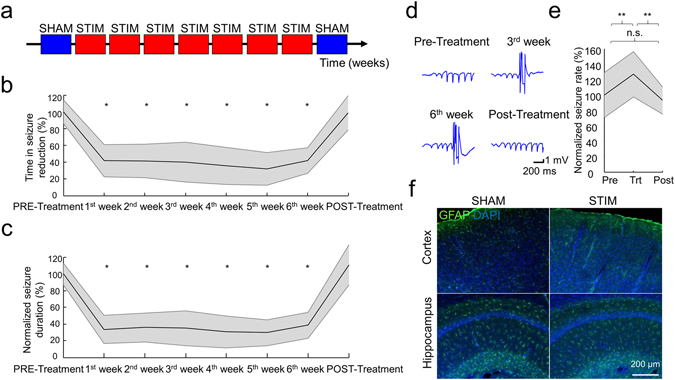
Results of the seizure suppression during the long-term stimulation protocol. (a) Experimental timeline. (b and c) Group data show the stable and similar decrease of Time in Seizure (b) and average seizure duration (c) as long as the closed-loop seizure suppression is on (each measure is normalized to its corresponding mean Pre-Treatment value for each animal). (d) Example LFP traces of one representative rat demonstrating the recording quality over the weeks. Note that the amplitudes and signal to noise ratios are qualitatively similar, suggesting a negligible change of the electrode conductance. (e) Group data show seizure rates before (Pre), during (Trt) and after (Post) the treatment (normalized to the average seizure rates during the Pre days for each animal). Shaded area represents ± SEM. (f) Representative histological examples of cortical and hippocampal regions of control (SHAM) and long term treated (STIM) animals, stained for GFAP (green) and DAPI (blue). Note that stimulation did not induce overt gross histological changes (i.e. gliosis) despite the long-term application. *p < 0.001, **p < 0.05 vs Pre-Treatment, one-way ANOVA (b,e), Kruskal-Wallis test (c), both followed by post hoc HSD.