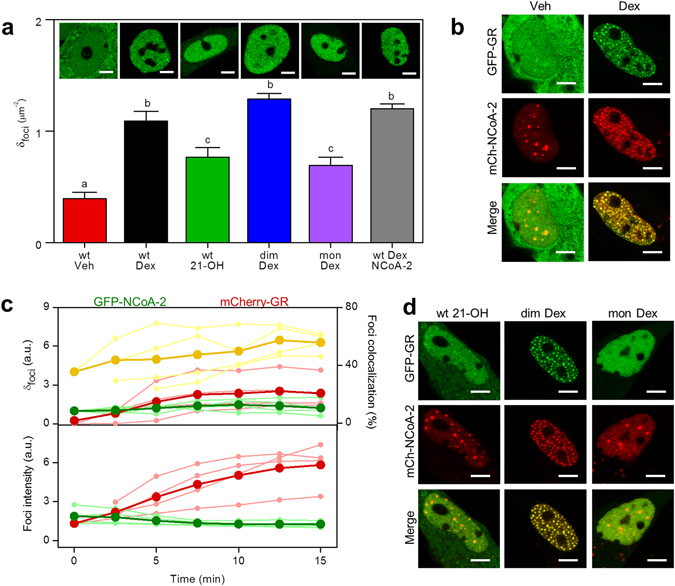
Figure 1.

Activated GR and NCoA-2 redistribute to colocalized intranuclear foci. Subcellular distribution of GFP-GR and mCherry-NCoA-2 in BHK cells was analyzed upon hormone induction by using different imaging tools as indicated in Methods section. (a) Cells expressing GFP fused to the indicated GR variant (wild type, GRdim, GRmon) were treated with Dex, 21-OH or vehicle (Veh). NCoA-2 was co-expressed where indicated (Scale bar: 5 µm). GR capability to form intranuclear foci was quantitatively analyzed by calculating the nuclear foci density (n = 15). Bars with the same superscript letters represent data not significantly different from each other (p < 0.05). (b) Subcellular distribution of GFP-GR and mCherry-NCoA-2 in untreated or Dex-stimulated cells (Scale bar: 5 µm). (c) Analysis of time-lapse images of cells co-expressing GFP-NCoA-2 and mCherry-GR, within 15 min after Dex-stimulation. Different image-analyisis tools were used to calculate the relative foci density (δ) (upper panel); percentage of colocalized foci (upper panel, yellow line) and the relative mean intensity of foci (lower panel). Light curves represent single cell data to illustrate the cell-to-cell variability while dark curves correspond to mean values. (d) Representative images of cells expressing mCherry-NCoA-2 and GFP fused to the indicated GR variant (wild type, GRdim, GRmon) and treated with Dex, 21-OH or Veh (Scale bar: 5 µm).
