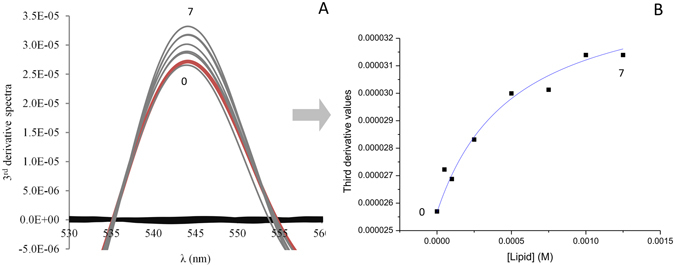
Figure 2.

Third-derivative absorption spectra (A) of doxorubicin (40 μM) (red line, 0) alone, incubated in DMPC:SM model membrane at 37 °C with increasing lipid concentration (7 represents the maximum lipid concentration) and the model membrane without drug (black lines). (B) represents the best fitting curve to experimental third-derivative spectrophotometric data (DT vs. [L]) using a nonlinear regression method at a wavelength of 544 nm.
