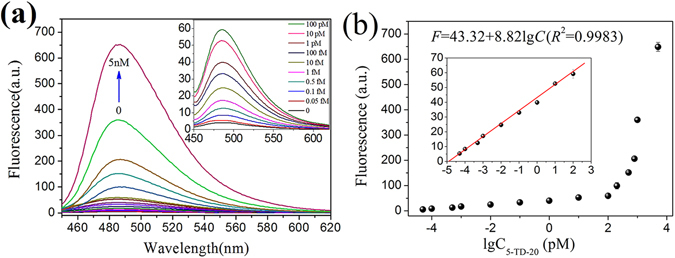
Figure 5.

5-TD-20 quantitation using ED-eRCA. (a) 5-TD-20 concentration-dependent fluorescent spectral change of the detection system; (b) 5-TD-20 concentration-dependent fluorescent signal change at 485 nm. The insert in (a) shows the fluorescence spectral change in the 5-TD-20 concentration range of 0–100 pM; The insert in (b) shows the fluorescence signal change at 485 nm in the 5-TD-20 concentration range of 0.05 fM–100 pM. The solid line represents a linear fit to the data. All experiments were performed in triplicate.
