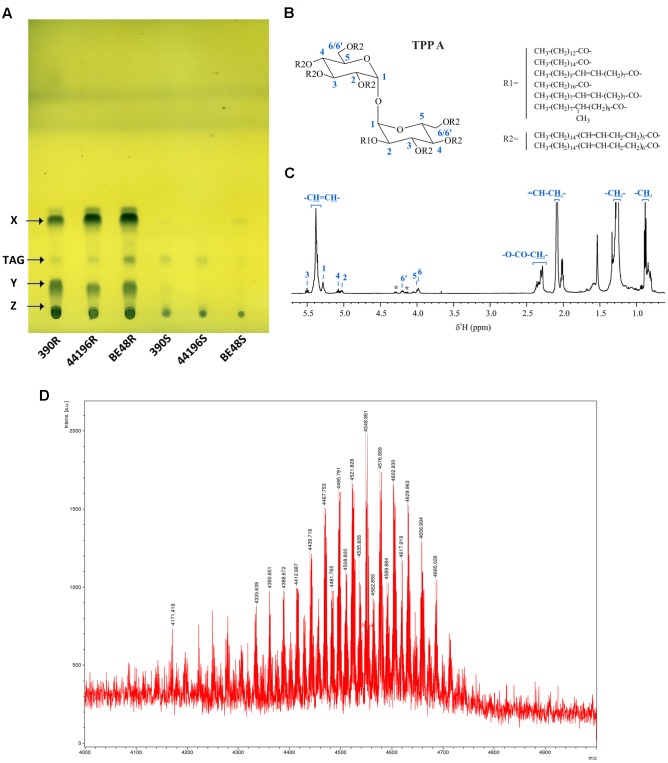
FIGURE 3.
Detection and characterization of compound X. (A) TLC of all PE extracts. The solvent system used was PE 60-80°C/diethyl ether (90:10, v/v), and the plates were revealed with 10% phosphomolybdic acid. X (Compound X), TAG (Triacylglycerides), Y (Compound Y), Z (Compound Z). (B) Chemical structure of Compound X purified from M. abscessus 390R. Length and structure of R1 and R2 were obtained from Burbaud et al. (2016). (C) 1H NMR spectra of compound X in CDCl3 with peaks corresponding to the TPP A assignment (asterisks denote signals of TAG impurities). (D) MALDI-TOF mass spectrum of compound X (region between m/z 4000 and 5000 is magnified).

