
FIGURE 4.
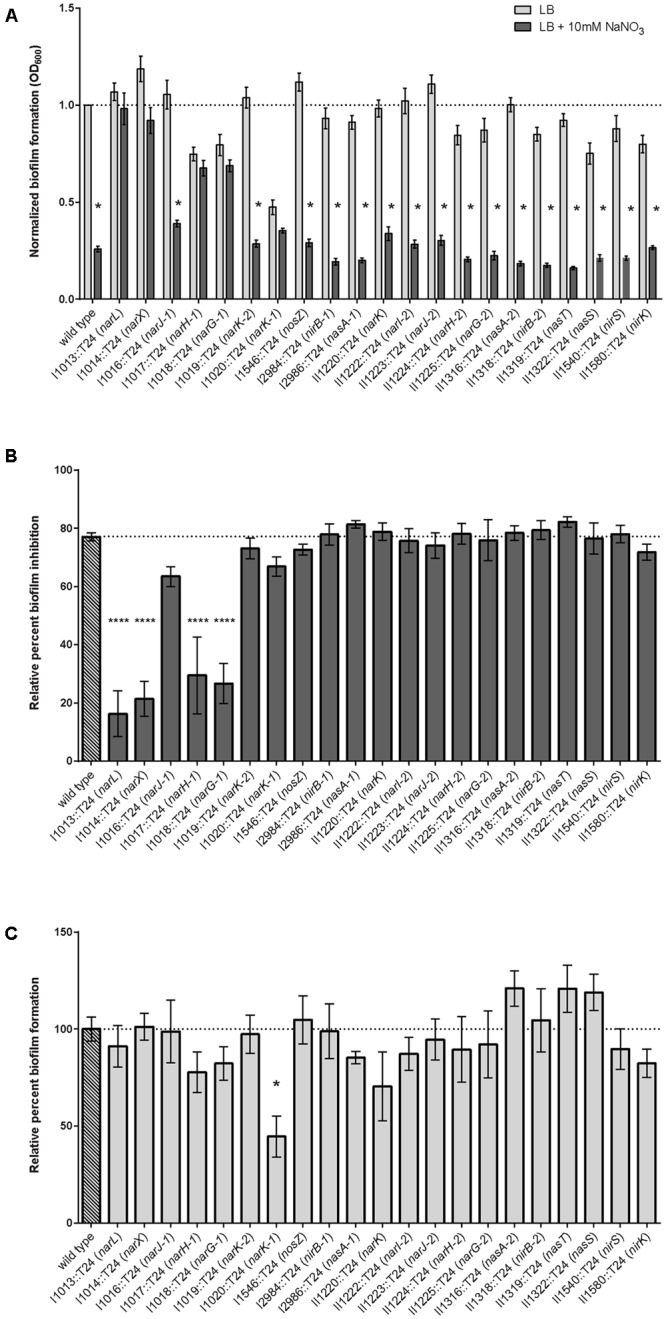
Quantitative evaluation of relative biofilm formation and biofilm inhibition in the presence and absence of sodium nitrate. (A) Biofilm formation was evaluated when grown statically in the presence of 10 mM NaNO3. Biofilm formation of the wild-type and 16 of the 21 transposon mutants identified in this study were inhibited by treatment with NaNO3, while five mutants {Bp1026b_I1013::T24 (narL), Bp1026b_I1014::T24 (narX), Bp1026b_I1017::T24 (narH-1), Bp1026b_I1018::T24 (narG-1), and Bp1026b_I1020::T24 (nark-1)} were not inhibited by treatment with NaNO3. Bars are representative of the means for individually normalized values for biofilm formation relative to the wild type. Asterisks indicate a significant difference (p < 0.0001) calculated with an unpaired Student’s t-test using the Holm-Sidak method to account for multiple comparisons (n = 12). (B) Percent biofilm inhibition for all mutants was calculated relative to inhibition of the wild type in the presence of 10 mM NaNO3. Bars are representative of the means for each mutant relative to the mean for the wild type. (C) Biofilm formation for all mutants was calculated relative to wild type biofilm formation in LB medium. Bars are representative of the means for each mutant relative to the mean for the wild type.