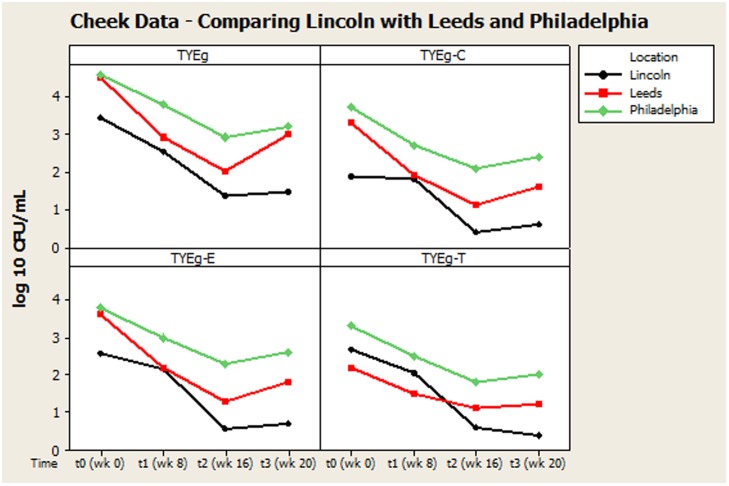
FIGURE 2.
Comparison of general trends of bacterial numbers on the cheek from participants from Lincoln, Leeds and Philadelphia, United States. The distribution of P. acnes from the cheek of patients are presented as mean CFUs per square cm across the cohort. The number of colonies isolated on TYEg agar with and without antibiotics for the clinical cohorts during treatment. Antibiotics are represented by E-erythromycin; C-clindamycin; and T-tetracycline. The data was transformed by log10. Data drawn from Coates et al. (2005).

