
Figure 4.
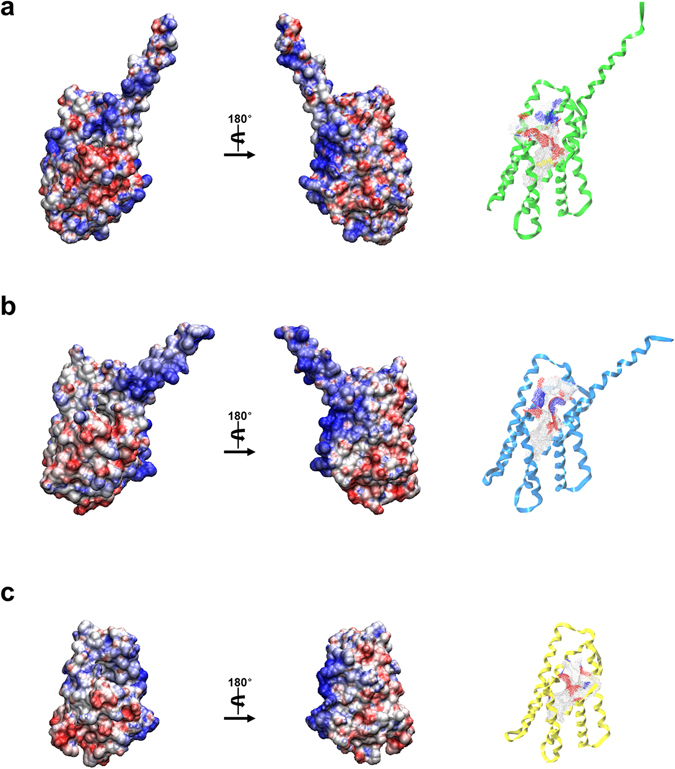
Structural comparison of (a) mTnfaip8, (b) hTIPE2 and (c) hTIPE3. The surface of the protein is drawn with an electrostatic surface model. Molecular surfaces were created by the VMD molecular-graphics software package33 following electrostatic calculations using APBS34 (red, negative; blue, positive; white, uncharged). The cavity is found and is depicted inside the ribbon diagram using the MOLCAD program of SYBYL-X2.0. The surface color of the cavity is represented according to the charge of residues comprising the cavity.