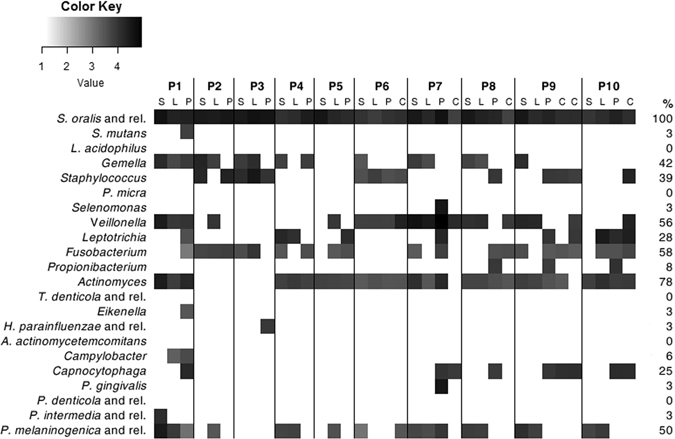
Figure 4.

Heatmap of the OralArray data. Samples were collected from ten subjects (P1-P10) at four oral sites (S: saliva, L: lingual plaque, P: supragingival plaque, C: healing cap) and analyzed by OralArray. Fluorescence intensities (IFs) were normalized over the IFs of the Zip Code 63, as described in the Methods section. The mean values of the logarithm of IFs (n = 4) for each bacterial target are plotted in a scale of grey, by using R “made4” package. Prevalence of bacterial targets in the oral samples are also reported, expressed in percentage (%).
