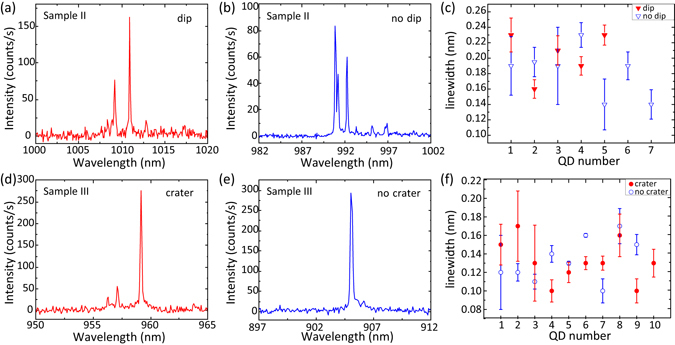
Figure 4.

Comparison of the spectral linewidths measured from quantum dots found in correspondence to surface morphological features and smooth surfaces. (a) and (d): Photoluminescence spectra, collected under non-resonant laser excitation at a temperature of 4 K, from single QDs aligned with surface features [dip-like (Sample II) in (a) and crater-like (Sample III) in (d)]. (b) and (e): Photoluminescence spectra from single QDs, collected from the same samples as the corresponding spectra in (a) and (d), but from areas not showing any surface features. (c) and (f): Linewidths, extracted from Lorentzian fits of single emission lines measured in photoluminescence spectra like the ones shown in panels (a), (b), (d), and (e), of QDs found in correspondence to morphological features (filled red symbols) and to smooth surfaces (open blue symbols). The error bars are obtained from one standard deviation uncertainties in the Lorentzian fits.
