
Figure 3.
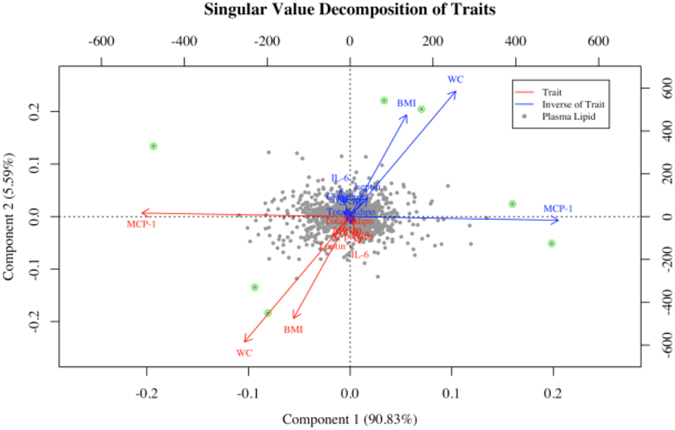
Singular value decomposition modeled on the 1,745 regression beta coefficients from plasma lipids in age and smoking regression for each respective parameter. ( ) represent the plasma lipid loading score into vectors 1 and 2. Plasma lipids are highlighted if radius >0.15. Parameters are listed in red text with red arrows and the inverse of the parameters are listed in blue text with blue arrows. The score of MCP-1 in vector 1 is scaled by a factor 25 (i.e., original score >12,000). Body mass index (BMI), waist circumference (WC), tumor necrosis factor-alpha (TNF- α), interferon gamma-induced protein-10 (IP-10), interleukin-6 (IL-6), monocyte chemoattractant protein-1 (MCP-1).