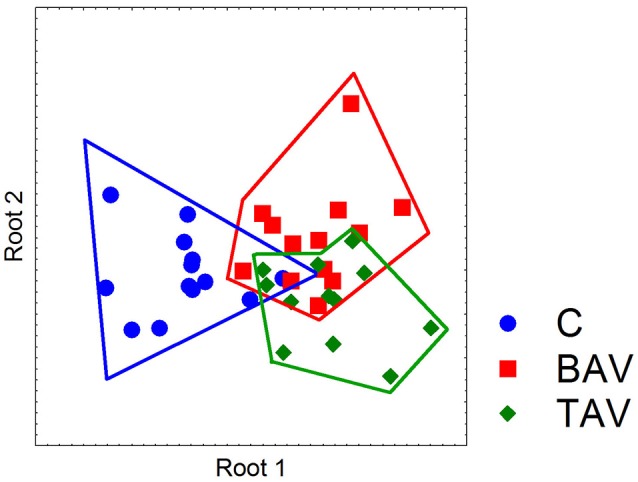
Figure 2.

Partition of the examined groups based on the results of discriminant analysis. Discriminant analysis was used to investigate what parameters in gene expression could divide groups of patients. Expression data on SMC differentiation markers (MYOCD, ACTA2, CNN, TAGLN, and VIM), Notch-related genes (NOTCH1, NOTCH2, NOTCH3, JAG1, HES1, HEY, SNAIL, and SLUG) and proosteogenic genes (BMP2, RUNX2, POSTIN, CTNNB1, SOX9, OPN, and OPG) were used. In the course of discriminant analysis 11 genes with high prognostic and discriminant value were identified (Table 2) and these genes were used to examine if the SMC from BAV, TAV, and control groups form independent clusters. Dot plot demonstrates that control SMC form a separate cluster from both BAV- and TAV groups by expression of Notch-related and proosteogenic genes, while BAV- and TAV-derived SMC clusters partially overlap.
