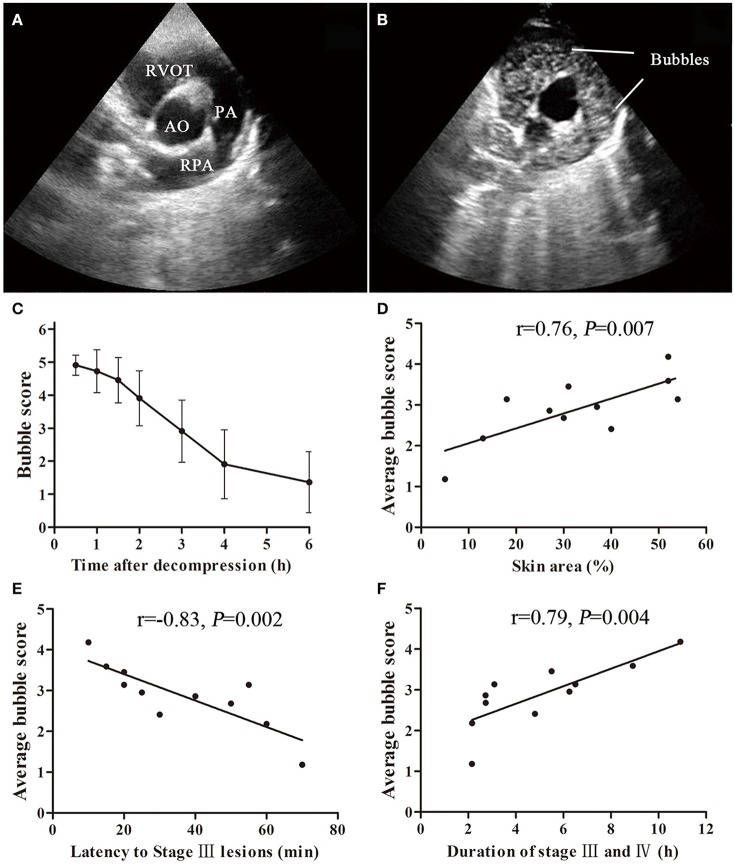
Figure 4.
Bubble formation and correlation with cutaneous lesions in a swine DCS model. Ultrasound bubble detection was performed on 11 swine after a simulated dive to 40 m-35 min with a rapid decompression. An aortic root short axis view was chosen, which shows aorta (AO), right ventricular outflow tract (RVOT), pulmonary artery (PA) and right PA (RPA) (A). Bubbles can be seen in RVOT and PA (B). The bubbles were scored by EB grading scale. Bubble amount decreased slowly during the detecting period from 0.5 to 6 h after decompression (C). Significant correlations between average bubble loads and latency to Stage III lesions, skin area (lesion area/whole body area) or duration of stage III and IV are shown (D–F).

