

Abstract
Proteinuria is one of the well-known risk factors for cardiovascular disease. However the impact of proteinuria on the incidence of atrial fibrillation (AF) is unclear. In this study, we investigated the association between proteinuria detected using urine dipstick test and the risk of AF. A total of 18,201,275 individuals were analyzed, who had no prior AF and had received biennial health checkups provided by the National Health Insurance Service between 2005 and 2008 in Korea. Incidences of AF were ascertained through the end of 2015. During a mean follow-up of 9.6 years, a total of 324,764 (1.8%) developed AF (1.86 per 1,000 person-years). In Cox regression models, proteinuria was associated with an increased risk of AF: adjusted HR and 95% CI of AF occurrence were 1.13 (1.10–1.16), 1.34 (1.31–1.38), 1.53 (1.48–1.58), 1.82 (1.71–1.94), and 1.86 (1.61–2.16) in individuals with trace, 1+, 2+, 3+, and 4+ proteinuria, respectively, compared with those without proteinuria. The result was consistent even after additional adjustment for estimated glomerular filtration rate. In addition, the risk of AF further increased or decreased according to the follow-up dipstick test results. Thus, proteinuria measured with a dipstick test might be considered a potent risk factor for AF development.
Introduction
Atrial fibrillation (AF) is associated with an increased risk of ischemic stroke and death1–3, and it has a significant impact on public health as its prevalence is increasing4, 5. Therefore, it is necessary to establish a simple health screening method capable of identifying those with a high risk of developing AF.
Proteinuria is an indicator of renal damage that is often detected earlier than any apparent decline in glomerular filtration rate (GFR). In addition to its role as a risk factor for chronic kidney disease (CKD), proteinuria itself is a predictor for cardiovascular morbidity and mortality, independently of conventional risk factors including CKD6–9. However, the impact of proteinuria on the incidence of AF has not been well understood. There are controversial data regarding the association of proteinuria with AF in large cohort studies. The Framingham Heart Study reported that urine albumin-to-creatinine ratio (ACR) was not associated with AF occurrence, whereas the Atherosclerosis Risk in Communities Study demonstrated a relationship between albumin-to-creatinine ratio and the risk of AF10, 11.
Urine protein-to-creatinine ratio (PCR) or ACR is commonly used to quantify the level of proteinuria. However, the cost of a PCR or ACR test renders it unsuitable for use in screening for proteinuria in a public health context. On the other hand, the urine dipstick test is a simple and inexpensive diagnostic tool for detecting proteinuria in public health screenings. The urine dipstick test can detect proteinuria with a high sensitivity and specificity of greater than 90%, when using ACR ≥300 mg/g as the reference standard12, 13. Dipstick-positive proteinuria is also associated with the risk of death, coronary heart disease, and progression to kidney failure at a given level of estimated GFR (eGFR)7–9. In this study, we sought to uncover whether the presence and grade of proteinuria as detected by urine dipstick test could act as a risk factor for AF development in a nationwide population-based cohort.
Methods
Data Sources
This study used the whole population database provided by the National Health Insurance Service (NHIS). The NHIS is a mandatory health insurance program managed by the Korean government, which covers 97% of the Korean population (approximately 50 million people). Records from the NHIS database include enrollees’ sociodemographic information, their use of inpatient and outpatient services, and pharmacy dispensing claims. To protect individuals’ privacy, resident registration numbers were encrypted.
Subjects in the NHIS are recommended to undergo standardized health checkups every two years. The health checkups between 2003–2008 included measurements of height, weight, and blood pressure and laboratory tests such as hemoglobin, fasting glucose, cholesterol, liver enzymes, and urinalysis. Data on past medical history, and health-related behaviors such as smoking, alcohol consumption, and physical activity were collected using standardized self-reporting questionnaires. In 2009, creatinine testing was incorporated and the self-reporting questionnaires were modified. This study was exempt from review by the Seoul National University Hospital Institutional Review Board (1607-055-775).
Study Cohort
We screened Korean residents aged 20 years or older who had undergone at least one of the biennial health checkups provided by the NHIS from January 1, 2005 to December 31, 2008. Individuals with prevalent AF at December 31, 2004 were excluded. A total of 18,201,275 subjects were identified from the NHIS database as the study population, who were followed up to 2015 (Main Cohort). As creatinine levels were measured in the biennial health checkups since 2009, we performed a sensitivity analysis using the Follow-up Cohort to adjust for renal function additionally. The Follow-up Cohort consisted of non-AF subjects who had undergone more than two health checkups at an interval of more than four years. As a result, a total of 15,220,897 subjects were included in the Follow-up Cohort from 2009 to 2013, who were followed up to 2015 (Supplemental Figure).
Definitions
The primary endpoint of this study was newly diagnosed non-valvular AF during the follow-up period. New-onset non-valvular AF was defined using International Classification of Diseases-Tenth Revision-Clinical Modification (ICD-10-CM) codes (I480–I484 and I489)14. Either one diagnosis during hospitalization, or more than two occasions of diagnosis at outpatient clinics were required for the diagnosis of AF. Individuals with a diagnosis of mitral stenosis (I050, I052, and I059) or those with mechanical heart valves (Z952–Z954) were excluded from the analysis. Subjects without AF during the follow-up period were censored at the date of their death or at the end of follow-up, whichever came first.
Baseline comorbidities were also evaluated during the screening period and defined using ICD-10-CM codes, as in our previous study15–17. Definitions of covariates are presented in the Supplemental Table.
Statistical Analysis
Data are presented as mean with standard deviation or numbers with percentages. Incidence rates of AF were calculated by dividing the number of events by 1000 person-years. Cox proportional hazards models were used to evaluate the association between proteinuria on dipstick test and the risk of AF. Model 1 was a Cox proportional model adjusted for age and sex. Model 2 was model 1 with additional adjustment for body mass index, smoking, alcohol consumption, and exercise frequency. Model 3 adjusted for cardiovascular comorbidities such as hypertension, diabetes, and dyslipidemia additionally to model 2. Model 4 was model 3 with additional covariates of ischemic heart disease, congestive heart failure, stroke, and chronic obstructive pulmonary disease. Model 5 was performed only for the Follow-up Cohort, which was model 4 with additional adjustment for estimated GFR. Interactions between variables were tested. Kaplan–Meier curves were plotted to show freedom from AF, and then compared with the log-rank test. Statistical analyses were performed using SAS version 9.2 (SAS Institute, Cary, NC, USA). A two-sided p-value < 0.05 was considered statistically significant.
Ethical Statement
Ethical approval was waived in this study by the Institutional Review Board (IRB) of Seoul National University Hospital (Seoul, Korea) (#IRB No. E-1607–055–775). Informed consent was not obtained because patient records and information were anonymized and de-identified prior to analysis.
Results
The baseline characteristics of the study cohort by categories of dipstick proteinuria are summarized in Table 1. The mean age of study population was 45.3 ± 14.6 years and 53.3% were male. Among a total of 18,201,275 study subjects, dipstick urinalysis showed negative protein in 96.76% (n = 17,611,940), trace in 1.49% (n = 270,707), 1+ in 1.18% (n = 214,883), 2+ in 0.46% (n = 83,251), 3+ in 0.10% (n = 17,386), and 4+ in 0.02% (n = 3,108). Subjects with a higher degree of proteinuria were more likely to be older, overweight, with a higher frequency of hypertension, diabetes, dyslipidemia, ischemic heart disease, myocardial infarction, congestive heart failure, stroke, and chronic obstructive lung disease.
Table 1.
Baseline characteristics of the study population.
| Characteristics | Proteinuria by Dipstick test | ||||||
|---|---|---|---|---|---|---|---|
| Total | Negative | Trace ( ± ) | 1+ | 2+ | 3+ | 4+ | |
| (N = 18,201,275) | (N = 17,611,940) | (N = 270,707) | (N = 214,883) | (N = 83,251) | (N = 17,386) | (N = 3,108) | |
| Age | 45.3 ± 14.6 | 45.2 ± 14.6 | 47.1 ± 14.9 | 49.5 ± 15.1 | 51.1 ± 15 | 52.2 ± 14.7 | 52.7 ± 14.8 |
| Age group | |||||||
| <45 years | 9,117,474 (50.1) | 8,883,857 (50.4) | 119,872 (44.3) | 80,439 (37.4) | 27,321 (32.8) | 5,109 (29.4) | 876 (28.2) |
| 45–64 years | 7,055,518 (38.8) | 6,795,612 (38.6) | 113,469 (41.9) | 97,099 (45.2) | 39,287 (47.2) | 8,539 (49.1) | 1,512 (48.7) |
| ≥65 years | 2,028,283 (11.1) | 1,932,471 (11.0) | 37,366 (13.8) | 37,345 (17.4) | 16,643 (20.0) | 3,738 (21.5) | 720 (23.2) |
| Sex category (Female) | 8,508,841 (46.7) | 8,228,925 (46.7) | 128,619 (47.5) | 103,563 (48.2) | 38,646 (46.4) | 7,739 (44.5) | 1,349 (43.4) |
| Height (cm) | 163.5 ± 9.2 | 163.5 ± 9.2 | 163.2 ± 9.2 | 162.5 ± 9.1 | 162.4 ± 9.1 | 162.3 ± 9.0 | 162.3 ± 9.0 |
| Body weight (kg) | 63.1 ± 11.4 | 63.1 ± 11.3 | 63.8 ± 11.8 | 64.1 ± 12.1 | 64.5 ± 12.4 | 64.6 ± 12.4 | 64.8 ± 12.3 |
| Body mass index (kg/m2) | 23.5 ± 3.3 | 23.5 ± 3.2 | 23.9 ± 3.4 | 24.2 ± 3.5 | 24.4 ± 3.7 | 24.4 ± 3.7 | 24.5 ± 3.8 |
| −18.5 | 788,860 (4.3) | 762,830 (4.3) | 11,970 (4.4) | 9,424 (4.4) | 3,735 (4.5) | 780 (4.5) | 121 (3.9) |
| 18.5–23 | 7,453,845 (41.1) | 7,248,747 (41.2) | 100,399 (37.1) | 72,093 (33.6) | 26,219 (31.5) | 5,401 (31.1) | 986 (31.7) |
| 23–25 | 4,409,486 (24.2) | 4,272,571 (24.3) | 63,800 (23.6) | 49,595 (23.1) | 18,847 (22.6) | 3,964 (22.8) | 709 (22.8) |
| 25–30 | 4,995,496 (27.5) | 4,805,162 (27.3) | 82868 (30.6) | 71,583 (33.3) | 28,846 (34.7) | 5,989 (34.5) | 1,048 (33.7) |
| 30- | 553,588 (3.0) | 522,630 (3.0) | 11,670 (4.3) | 12,188 (5.7) | 5,604 (6.7) | 1,252 (7.2) | 244 (7.9) |
| Systolic blood pressure (mmHg) | 123.4 ± 16.6 | 123.2 ± 16.2 | 125.2 ± 17.7 | 128.6 ± 19.1 | 131.5 ± 20 | 134 ± 20.6 | 134.3 ± 21.1 |
| Diastolic blood pressure (mmHg) | 77.1 ± 10.9 | 77 ± 10.7 | 78 ± 11.5 | 79.8 ± 12 | 81.2 ± 12.3 | 82.1 ± 12.5 | 81.8 ± 12.6 |
| Smoking status | |||||||
| Never smoker | 11,989,926 (66.0) | 11,595,519 (65.8) | 179,653 (66.4) | 145,118 (67.5) | 55,954 (67.2) | 11,617 (66.8) | 20,65 (66.4) |
| Ex-smoker | 1,488,847 (8.2) | 1,437,165 (8.2) | 23,468 (8.7) | 18,557 (8.6) | 7,702 (9.3) | 1,647 (9.5) | 308 (9.9) |
| Current smoker | 4,722,502 (26.0) | 4,579,256 (26.0) | 67,586 (25.0) | 51,208 (23.8) | 19,595 (23.5) | 4,122 (23.7) | 735 (23.7) |
| Alcohol drinking | |||||||
| Complete or near abstinence | 9,490,024 (52.1) | 9,169,243 (52.1) | 142,596 (52.7) | 118,856 (55.3) | 47,212 (56.7) | 10,260 (59.0) | 1,857 (59.8) |
| Moderate consumption | |||||||
| (≤4 glasses per week) | 3,023,297 (16.6) | 2,937,260 (16.7) | 41,935 (15.5) | 30,230 (14.1) | 11,291 (13.6) | 2,207 (12.7) | 374 (12.0) |
| Heavy drinking | |||||||
| (≥5 glasses per week) | 5,687,954 (31.3) | 5,505,437 (31.3) | 86,176 (31.8) | 65,797 (30.6) | 24,748 (29.7) | 4,919 (28.3) | 877 (28.2) |
| Exercise | |||||||
| No | 10,009,473 (55.0) | 9,688,062 (55.0) | 145,150 (53.6) | 118,756 (55.3) | 46,133 (55.4) | 9,647 (55.5) | 1,725 (55.5) |
| 1–4 times a week | 6,699,138 (36.8) | 6,489,208 (36.9) | 100,123 (37.0) | 74,701 (34.8) | 28,229 (33.9) | 5,848 (33.6) | 1,029 (33.1) |
| 5–7 times a week | 1,492,664 (8.2) | 1,434,670 (8.2) | 25,434 (9.4) | 21,426 (10.0) | 8,889 (10.7) | 1,891 (10.9) | 354 (11.4) |
| Comorbidities | |||||||
| Hypertension | 5,216,608 (28.7) | 4,954,357 (28.1) | 100,006 (36.9) | 101,722 (47.3) | 47,273 (56.8) | 11,215 (64.5) | 2,035 (65.5) |
| Diabetes | 1,636,476 (9.0) | 1,513,221 (8.6) | 40,662 (15.0) | 49,507 (23.0) | 25,145 (30.2) | 6,633 (38.2) | 1,308 (42.1) |
| Dyslipidemia | 2,754,129 (15.1) | 2,609,021 (14.8) | 55,882 (20.6) | 54,806 (25.5) | 26,246 (31.5) | 6,834 (39.3) | 1,340 (43.1) |
| Ischemic heart disease | 457,659 (2.5) | 428,605 (2.4) | 10,190 (3.8) | 11,083 (5.2) | 5,903 (7.1) | 1,546 (8.9) | 332 (10.7) |
| History of MI | 130,590 (0.7) | 122,971 (0.7) | 2,712 (1.0) | 2,864 (1.3) | 1,528 (1.8) | 427 (2.6) | 88 (2.8) |
| Congestive heart failure | 109,719 (0.6) | 102,512 (0.6) | 2,341 (0.9) | 2,772 (1.3) | 1,529 (1.8) | 457 (2.6) | 108 (3.5) |
| History of stroke | 184,509 (1.0) | 172,012 (1.0) | 4,315 (1.6) | 5,014 (2.3) | 2,408 (2.9) | 633 (3.6) | 127 (4.1) |
| COPD | 961,643 (5.3) | 922,628 (5.2) | 16,087 (5.9) | 14,767 (6.9) | 6,413 (7.7) | 1,454 (8.4) | 294 (9.5) |
| Follow-up (years) | 9.6 ± 1.9 | 9.6 ± 1.9 | 9.4 ± 2.0 | 9.2 ± 2.2 | 9 ± 2.4 | 8.7 ± 2.7 | 8.4 ± 2.8 |
Values are n (%) or mean ± SD.
COPD, chronic obstructive pulmonary disease; MI, myocardial infarction.
During 9.6 ± 1.9 years of follow-up, 324,764 individuals (1.8% of the total population) developed AF. The median time to AF development was 5.3 years. Unadjusted risk factors for AF are presented in Table 2. Both traditional risk factors and proteinuria demonstrated a relationship with AF development, and the degree of proteinuria was shown to be strongly correlated with the risk of AF development.
Table 2.
Age and sex-adjusted hazard ratios for the risk of atrial fibrillation.
| Characteristics | HR (95% CI) | P value |
|---|---|---|
| Age | <0.001 | |
| <45 years | 1 | |
| 45–64 years | 1.39 (1.37–1.41) | |
| ≥65 years | 1.43 (1.39–1.46) | |
| Female sex | 0.65 (0.64–0.65) | <0.001 |
| Height – per 10 cm | 1.30 (1.30–1.31) | <0.001 |
| Body weight – per 10 kg | 1.28(1.27–1.28) | <0.001 |
| Body mass index | <0.001 | |
| Underweight (<18.5 kg/m2) | 0.98 (0.96–1.00) | |
| Normal range (18.5–22.9 kg/m2) | 1 | |
| Overweight (23–24.9 kg/m2) | 1.13 (1.12–1.14) | |
| Obese, class I (25–29.9 kg/m2) | 1.37 (1.36–1.38) | |
| Obese, class II (≥30 kg/m2) | 1.93 (1.89–1.96) | |
| Systolic blood pressure – per 10 mmHg | 1.06 (1.06–1.06) | <0.001 |
| Diastolic blood pressure – per 10 mmHg | 1.09 (1.09–1.10) | <0.001 |
| Smoking status | <0.001 | |
| Never smoker | 1 | |
| Ex-smoker | 1.07 (1.06–1.08) | |
| Current smoker | 1.01 (1.00–1.02) | |
| Alcohol drinking | <0.001 | |
| Complete or near abstinence | 1 | |
| Moderate consumption (≤4 glasses per week) | 0.96 (0.95–0.97) | |
| Heavy drinking (≥5 glasses per week) | 1.10 (1.09–1.11) | |
| Exercise | <0.001 | |
| No | 1 | |
| 1–4 times a week | 0.98 (0.98–0.99) | |
| 5–7 times a week | 1.03 (1.02–1.04) | |
| Comorbidities | ||
| Hypertension | 1.23 (1.22–1.24) | <0.001 |
| Diabetes mellitus | 1.23 (1.21–1.24) | <0.001 |
| Dyslipidemia | 0.95 (0.94–0.96) | <0.001 |
| Ischemic heart disease | 2.28 (2.26–2.31) | <0.001 |
| History of MI | 2.55 (2.48–2.62) | <0.001 |
| Congestive heart failure | 3.76 (3.70–3.83) | <0.001 |
| History of stroke | 1.61 (1.58–1.63) | <0.001 |
| COPD | 1.34 (1.33–1.36) | <0.001 |
| Laboratory findings | ||
| Urine protein | <0.001 | |
| Negative | 1 | |
| Trace (±) | 1.21 (1.18–1.24) | |
| 1+ | 1.53 (1.50–1.57) | |
| 2+ | 1.84 (1.78–1.90) | |
| 3+ | 2.28 (2.13–2.43) | |
| 4+ | 2.51 (2.17–2.91) | |
COPD, chronic obstructive pulmonary disease; CI, confidence intervals; HR, hazard ratio; MI, myocardial infarction
Proteinuria on dipstick test as an independent risk factor for atrial fibrillation
Figure 1 shows Kaplan-Meier survival curves of freedom from AF for up to 11 years according to the degree of proteinuria detected by dipstick test. The annual incidence rate of AF was 1.8 per 1,000 person-years for the negative proteinuria group, 2.5 for the trace proteinuria group, 3.6 for the 1+, 4.7 for the 2+, 6.1 for the 3+, and 6.8 for the 4+ group, respectively. Higher levels of proteinuria were associated with a higher risk of AF development (p for trend < 0.001). The incidence rate of AF in subjects with proteinuria 4+ was approximately two times higher compared to that in subjects with negative proteinuria (HR 2.05, 95% CI 1.77–2.37, p < 0.001) after adjusting for age, sex, body mass index, smoking, alcohol consumption, exercise frequency, hypertension, diabetes, and dyslipidemia (Table 3, model 3). The HRs were only slightly attenuated after additional adjustment for ischemic heart disease, congestive heart failure, stroke, and chronic obstructive pulmonary disease (HR 1.86, 95% CI 1.61–2.16, p < 0.001, Table 3, model 4). A proportional increase in the risk of AF with the level of proteinuria was consistent regardless of age groups, sex, hypertension, diabetes mellitus, and chronic kidney disease (Fig. 2).
Figure 1.
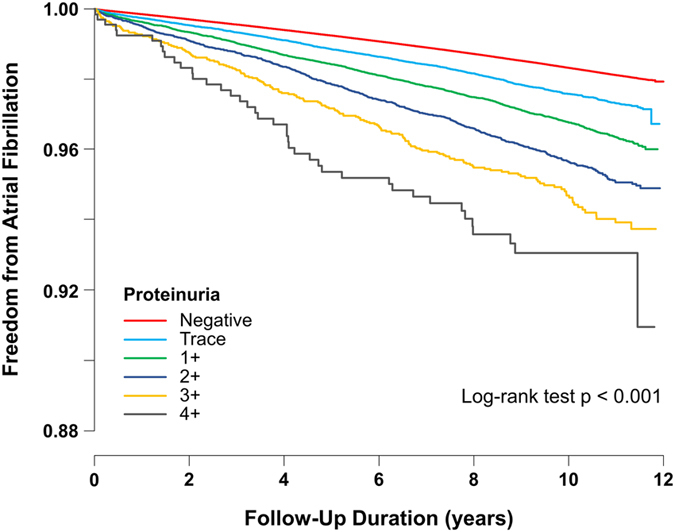
Kaplan-Meier survival curves for freedom from atrial fibrillation. Subjects with higher levels of proteinuria were associated with a higher risk of atrial fibrillation during the follow-up period than those with lower levels of proteinuria.
Table 3.
Incidence and risk of atrial fibrillation according to the degree of proteinuria by dipstick test adjusted for other covariates in the Main Cohort (between 2005 and 2008).
| Proteinuria by Dipstick test | P for trend | ||||||
|---|---|---|---|---|---|---|---|
| Negative | Trace (±) | 1+ | 2+ | 3+ | 4+ | ||
| AF cases | 306,536 | 6,379 | 7,216 | 3,536 | 920 | 177 | |
| Person-years | 169,293,090 | 2,542,006 | 1,985,107 | 750,175 | 151,649 | 26,213 | |
| AF incidence* | 1.81 | 2.51 | 3.64 | 4.71 | 6.07 | 6.75 | |
| Model 1 HR (95% CI) | 1 | 1.21 (1.18–1.24) | 1.53 (1.50–1.57) | 1.84 (1.78–1.90) | 2.28 (2.14–2.43) | 2.51 (2.17–2.91) | <0.001 |
| Model 2 HR (95% CI) | 1 | 1.19 (1.16–1.22) | 1.48 (1.45–1.51) | 1.76 (1.70–1.82) | 2.19 (2.05–2.33) | 2.41 (2.08–2.79) | <0.001 |
| Model 3 HR (95% CI) | 1 | 1.13 (1.11–1.16) | 1.36 (1.33–1.39) | 1.56 (1.51–1.62) | 1.89 (1.77–2.01) | 2.05 (1.77–2.37) | <0.001 |
| Model 4 HR (95% CI) | 1 | 1.13 (1.10–1.16) | 1.34 (1.31–1.38) | 1.53 (1.48–1.58) | 1.82 (1.71–1.94) | 1.86 (1.61–2.16) | <0.001 |
AF, atrial fibrillation; CI, confidence intervals; HR, hazard ratios
*Per 1000 person-years
Model 1: Cox proportional model adjusted for age and sex. Model 2: model 1 with additional adjustment for body mass index, smoking, alcohol consumption, and exercise frequency. Model 3: model 2 with additional adjustment for diabetes, hypertension, dyslipidemia. Model 4: model 3 with additional adjustment for ischemic heart disease, congestive heart failure, stroke, and chronic obstructive pulmonary disease.
Figure 2.
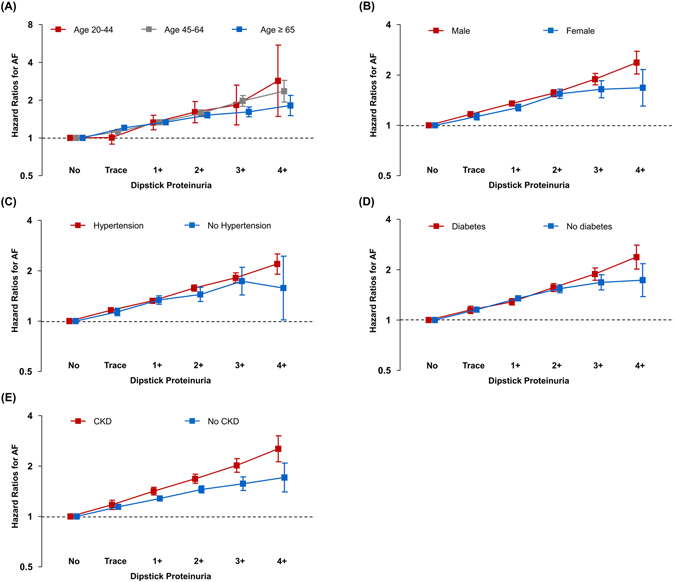
Subgroup analysis. Graded risk of atrial fibrillation development according to the severity of dipstick proteinuria was consistent regardless of (A) age, (B) sex, (C) hypertension, (D) diabetes mellitus, and (E) chronic kidney disease. Hazard ratios were calculated using a Cox proportional model adjusted for age, sex, body mass index, smoking, alcohol consumption, exercise frequency, diabetes, hypertension, dyslipidemia, ischemic heart disease, congestive heart failure, stroke, and chronic obstructive pulmonary disease, except for the stratification variable. AF, atrial fibrillation; CKD, chronic kidney disease
Proteinuria on dipstick and graded risk of AF after adjustment of kidney function
To adjust the impact of kidney function on the risk of AF, a sensitivity analysis was performed using the Follow-up Cohort which included data on serum creatinine levels. eGFR was calculated using the Cockcroft-Gault equation and added to the multivariable analysis. After adjustment for potential confounders including eGFR, there was a graded risk of AF according to the severity of dipstick proteinuria (p for trend < 0.001, Table 4, model 5). The positive correlation between AF risk and the degree of dipstick proteinuria was consistent across all three categories of eGFR (<30 mL/min, 30~60 mL/min, and ≥ 60 mL/min,). The association between the grade of proteinuria and AF risk was strongest in the group with eGFR < 30 mL/min compared with other groups (Fig. 3).
Table 4.
Incidence and risk of atrial fibrillation according to the degree of proteinuria by dipstick test adjusted for other covariates in the Follow-up Cohort (between 2009 and 2013).
| Proteinuria by Dipstick test | P for trend | ||||||
|---|---|---|---|---|---|---|---|
| Negative | Trace (±) | 1+ | 2+ | 3+ | 4+ | ||
| AF cases | 153,673 | 5,045 | 5,160 | 2,691 | 920 | 227 | |
| Person-years | 79,960,610 | 1,878,771 | 1,331,291 | 503,385 | 129,868 | 25,398 | |
| AF incidence* | 1.92 | 2.69 | 3.88 | 5.35 | 7.08 | 8.94 | |
| Model 1 HR (95% CI) | 1 | 1.24 (1.21–1.28) | 1.51 (1.47–1.55) | 1.88 (1.80–1.95) | 2.32 (2.18–2.48) | 2.74 (2.40–3.13) | <0.001 |
| Model 2 HR (95% CI) | 1 | 1.22 (1.19–1.26) | 1.46 (1.42–1.50) | 1.80 (1.73–1.87) | 2.22 (2.08–2.37) | 2.65 (2.32–3.03) | <0.001 |
| Model 3 HR (95% CI) | 1 | 1.16 (1.12–1.19) | 1.34 (1.30–1.38) | 1.58 (1.52–1.64) | 1.88 (1.76–2.01) | 2.24 (1.96–2.56) | <0.001 |
| Model 4 HR (95% CI) | 1 | 1.15 (1.12–1.19) | 1.32 (1.29–1.36) | 1.55 (1.49–1.62) | 1.81 (1.69–1.93) | 2.13 (1.86–2.43) | <0.001 |
| Model 5 HR (95% CI) | 1 | 1.15 (1.11–1.18) | 1.30 (1.27–1.34) | 1.51 (1.45–1.57) | 1.73 (1.62–1.85) | 2.03 (1.77–2.31) | <0.001 |
AF, atrial fibrillation; CI, confidence intervals; HR, hazard ratios.
*Per 1000 person-years.
Model 1 to 4: Cox proportional models as in Table 3. Model 5: model 4 with additional adjustment for estimated glomerular filtration rate.
Figure 3.
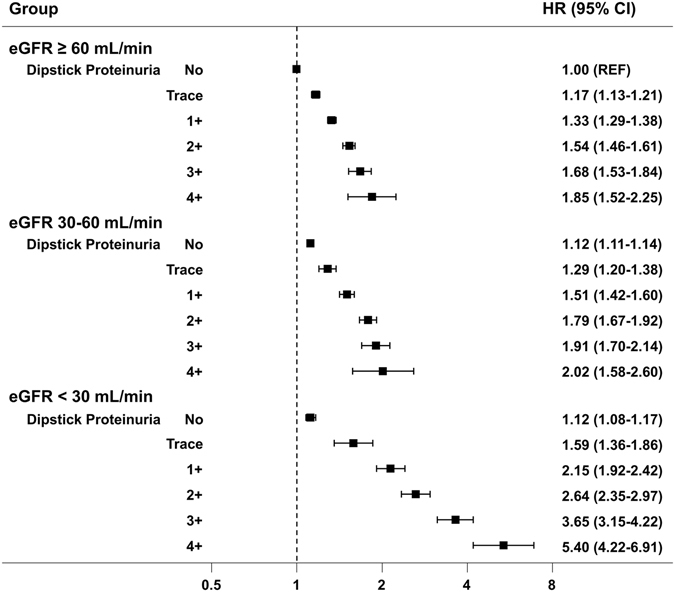
The risk of atrial fibrillation (AF) according to the dipstick proteinuria and estimated glomerular filtration rate in the Follow-up Cohort. The positive correlation between atrial fibrillation development and the degree of dipstick proteinuria was consistent across all three categories of estimated glomerular filtration rate. Hazard ratios were calculated using a Cox proportional model adjusted for age, sex, body mass index, smoking, alcohol consumption, exercise frequency, diabetes, hypertension, dyslipidemia, ischemic heart disease, congestive heart failure, stroke, and chronic obstructive pulmonary disease. AF, atrial fibrillation; eGFR, estimated glomerular filtration rate
Change in proteinuria on dipstick and risk of AF
We sought to determine whether there is difference in the risk of AF according to the change in the dipstick test results over time, using the Follow-up Cohort. Among individuals who had undergone more than two dipstick tests, two test results were selected that were at least four years apart. Most subjects (n = 14,126,994, 92.8%) who showed initially negative dipstick results were still negative on subsequent tests. However, in those with trace or positive results during the follow-up period, the risk of AF increased significantly after adjustment for covariates (Table 5). Among those whose proteinuria progressively increased, the risk of AF increased by nearly 40% (negative to≥1+, HR 1.36, 95% CI 1.33–1.39; trace to ≥1+, HR 1.38, 95% CI 1.25–1.52). In contrast, in subjects whose proteinuria was resolved, the risk of AF decreased significantly. In subjects who showed trace results at baseline and a negative result on the follow-up test, there was no significant change in the risk of AF compared to those whose levels remained trace on the follow-up test (HR 1.06, 95% CI 1.02–1.10; HR 1.09, 95% CI 0.94–1.27). However, in those with greater than 1+ levels of proteinuria at baseline and a negative result on the follow-up test, the risk of AF decreased compared to those who remained at the same level (HR 1.15, 95% CI 1.10–1.19 vs. HR 1.69, 95% CI 1.61–1.77).
Table 5.
Risk of atrial fibrillation according to the follow-up dipstick test.
| Change in proteinuria | Subject number | AF cases | HR (95% CI) | ||||||
|---|---|---|---|---|---|---|---|---|---|
| Model 1 | Model 2 | Model 3 | Model 4 | Model 5* | |||||
| Negative | → | Negative | 14,126,994 | 148,173 | 1 | 1 | 1 | 1 | 1 |
| Negative | → | Trace | 320,945 | 4,534 | 1.23 (1.19–1.26) | 1.21 (1.17–1.24) | 1.15 (1.11–1.18) | 1.14 (1.11–1.18) | 1.14 (1.10–1.17) |
| Negative | → | ≥1+ | 304,660 | 6,753 | 1.58 (1.55–1.62) | 1.53 (1.50–1.57) | 1.40 (1.36–1.43) | 1.38 (1.34–1.41) | 1.36 (1.33–1.39) |
| Trace | → | Negative | 194,523 | 2,470 | 1.13 (1.09–1.18) | 1.11 (1.07–1.16) | 1.07 (1.02–1.11) | 1.06 (1.02–1.11) | 1.06 (1.02–1.10) |
| Trace | → | Trace | 11,555 | 179 | 1.23 (1.06–1.43) | 1.19 (1.03,1.38) | 1.10 (0.95–1.27) | 1.11 (0.96–1.29) | 1.09 (0.94–1.27) |
| Trace | → | ≥1+ | 15,033 | 406 | 1.74 (1.58–1.92) | 1.65 (1.50–1.82) | 1.44 (1.31–1.59) | 1.42 (1.29–1.57) | 1.38 (1.25–1.52) |
| ≥1+ | → | Negative | 182,234 | 3,030 | 1.33 (1.28–1.37) | 1.28 (1.24–1.33) | 1.18 (1.14–1.22) | 1.16 (1.12–1.20) | 1.15 (1.10–1.19) |
| ≥1+ | → | Trace | 13,641 | 332 | 1.73 (1.55–1.93) | 1.66 (1.49–1.85) | 1.46 (1.31–1.63) | 1.42 (1.27–1.58) | 1.38 (1.24–1.54) |
| ≥1+ | → | ≥1+ | 51,312 | 1,839 | 2.31 (2.21–2.42) | 2.19 (2.09–2.30) | 1.84 (1.75–1.93) | 1.78 (1.70–1.86) | 1.69 (1.61–1.77) |
AF, atrial fibrillation; CI, confidence intervals; HR, hazard ratios.
Model 1 to 5: Cox proportional models as in Table 4. Covariates adjusted in these models were acquired at the time of the secondary dipstick urine tests.
*In model 5, estimated glomerular filtration rate was calculated based on the follow-up health checkup data.
Discussion
To the best of our knowledge, this is the largest population-based study to examine the impact of the proteinuria dipstick test on the risk of AF. The present study demonstrated the following findings: (1) Proteinuria detected using a dipstick test was significantly associated with an increased risk of AF development; (2) there was a graded risk of AF according to the severity of dipstick proteinuria; (3) dipstick proteinuria was an independent risk factor for AF, even after accounting for potential confounders, including GFR; and (4) the risk of AF increased or decreased according to the results of the follow-up dipstick test.
Proteinuria, particularly microalbuminuria, can be observed in the absence of any evident renal disease and earlier than any apparent decline in GFR, even in the nondiabetic and non-hypertensive population18. In such cases, urinary protein excretion reflects not only subclinical renal disease, but also generalized endothelial dysfunction19, 20. Moreover, proteinuria is more frequent in patients with diabetes mellitus, high blood pressure, and diseases that cause chronic inflammation, all of which are established risk factors for AF21–23. In addition, several studies recently reported that AF is closely associated with the presence of proteinuria11, 24–26. Therefore, proteinuria may indeed serve as a sentinel marker for AF risk.
It is generally recommended to measure ACR or PCR in “spot” urine samples to quantify and qualify the degree of proteinuria27. The urine dipstick test has a high sensitivity and specificity in screening proteinuria when compared with PCR or ACR. An Australian cohort study reported that a dipstick result of at least 1+ or greater identified ACR≥300 mg/g with 98.9% sensitivity and 92.6% specificity12. In the Korean elderly population, a cutoff value of 1+ also exhibited a high sensitivity and specificity (95.6% and 92.2%, respectively) in detecting ACR ≥300 mg/g and PCR 0.5 g/g (sensitivity, 95.6%; specificity, 86.9%)13. Therefore, dipstick proteinuria of 1+ or greater can reliably identify significant proteinuria. Although a dipstick test could detect proteinuria with a high sensitivity and specificity, it could generate unacceptable false-positive rates in population-based screening since the prevalence of significant proteinuria is low in the general population28. Furthermore, the grading of proteinuria is only semi-quantitative and dependent on urine concentration. A dipstick result of 1+ refers to approximately 30 mg of protein per dL; 2+ refers to 100 mg/dL; 3+ to 300 mg/dL, and 4+ to 1,000 mg/dL29. Nonetheless, the urine dipstick test is still recommended as an initial test for the evaluation of CKD27 and is widely used, particularly in population-based health screening, due to its simplicity and low-cost30, 31. In this study, proteinuria on dipstick test, conducted in a context of population-based screening, was proven to be a strong risk factor for AF development.
CKD is a well-known risk factor for cardiovascular disease32, reduced kidney function is associated with increased risk of not only coronary heart disease, heart failure, and mortality, but also AF11, 33, 34. Lower eGFR was reported to be associated with incident AF even within the normal or mildly impaired range35. Since proteinuria is a primary marker of kidney damage and is associated with poorer outcomes in CKD patients, it is difficult to elucidate the impact of proteinuria on the development of AF. In our study, after adjusting for kidney function either by inclusion of eGFR as a covariate or by subgroup analysis according to the presence of CKD, we found that proteinuria is in fact an independent risk factor for AF development.
Proteinuria itself is also a risk factor for cardiovascular outcomes, independently of conventional risk factors including CKD6–9. The Reduction in Endpoints in Non–insulin dependent diabetes mellitus with the Angiotensin II Antagonist Losartan (RENAAL) study showed the renal protective effect of losartan in patients with diabetic nephropathy, which resulted in the reduction of proteinuria and an improvement in cardiovascular outcomes36. Although we do not have a definite explanation regarding how proteinuria has decreased in our study, we found that the decrease in proteinuria between serial dipstick tests was associated with the reduction in AF risk in the general population. Interestingly, in individuals whose proteinuria had progressed from negative to ≥1+, the risk of AF increased by approximately 40%. Proteinuria on dipstick test was shown to be an independent risk factor for AF development. However, it was also found to be a modifiable risk factor for AF development.
Our study has several limitations. First, this study is a nationwide population-based retrospective observational study, which is susceptible to several biases including selection bias. The NHIS provides biennial health checkups to all health insurance subscribers, but only half of the subjects actually received these medical examinations. Therefore, the study population most likely included those who maintain healthier lifestyles, or those who are more concerned about their health. Second, the incidence of AF was based entirely on claim data and there could have been undetected or unreported incidences of AF. There is an inherent possibility of underestimation of silent AF because population studies using claim data do not, by nature, screen subjects directly with ECG. Conversely, misclassification of AF diagnostic codes could lead to overestimation of AF. Frequent and long-term monitoring is reported to improve the detection rate of AF37, 38. Third, a baseline urine dipstick protein was obtained by a single measurement. This may lead to random measurement error and regression dilution bias39, 40, which tends to underestimate the real association between proteinuria and AF development. Since dipstick urinalysis is a semi-quantitative test, it has its own variability. Changes in the level of proteinuria during the follow-up may also dilute the impact of proteinuria on the risk of AF development. Although we did not correct the regression dilution bias directly, we assessed the risk of AF development according to the change in dipstick proteinuria over time, which showed that the risk of AF development increased by approximately 40% among those whose proteinuria grade increased. Fourth, in the current study, data regarding prescription medication use were not available. Studies have shown that angiotensin-converting enzyme inhibitors (ACEIs) and angiotensin II receptor blockers (ARBs) reduce proteinuria and protect against deterioration in renal function in patients with diabetic nephropathy41. ACEIs and ARBs are also known to prevent new-onset AF42. Thus, data on prescription medications, especially ACEIs and ARBs, would have enriched our results. Fifth, this study was composed of an entirely Korean population. Therefore, the results may not be generalizable to other ethnicities. Lastly, the self-reported questionnaires might have a limited quality of information and lack verification.
In conclusion, we found that proteinuria detected by urine dipstick test is a potent risk factor for AF development. There was graded risk of AF according to the severity of dipstick proteinuria. Moreover, the risk of AF was shown to decrease or increase according to the results of follow-up dipstick tests. The urine dipstick test could be a simple and easy way to predict the risk of AF in the general population. However, further investigations are needed to determine whether dipstick test screening could be used as a method to stratify individuals at risk of AF who require more intensive monitoring and stroke prevention.
Electronic supplementary material
Acknowledgements
This study was supported by National Research Foundation of Korea (NRF) funded by the Ministry of Education [2014R1A1A2A16055218], Science and Technology; and Korean Healthcare technology R&D project funded by the Ministry of Health & Welfare [HI15C1200].
Author Contributions
W.H.L. and E.K.C. contributed to the idea and design of this study; K.D.H. and S.H.K. prepared and checked clinical coding, undertook the data analysis; W.H.L. and E.K.C. wrote the draft; T.M.R., H.J.L., S.R.L. and M.J.C. contributed to data collection and analysis; and S.O. revised the manuscript; all authors have seen and approved the final version of the report.
Competing Interests
The authors declare that they have no competing interests.
Footnotes
Electronic supplementary material
Supplementary information accompanies this paper at doi:10.1038/s41598-017-06579-0
Publisher's note: Springer Nature remains neutral with regard to jurisdictional claims in published maps and institutional affiliations.
References
- 1.Benjamin EJ, et al. Impact of atrial fibrillation on the risk of death: the Framingham Heart Study. Circulation. 1998;98:946–952. doi: 10.1161/01.CIR.98.10.946. [DOI] [PubMed] [Google Scholar]
- 2.Wolf PA, Abbott RD, Kannel WB. Atrial fibrillation as an independent risk factor for stroke: the Framingham Study. Stroke. 1991;22:983–988. doi: 10.1161/01.STR.22.8.983. [DOI] [PubMed] [Google Scholar]
- 3.Jung BC, et al. The Korean Heart Rhythm Society’s 2014 Statement on Antithrombotic Therapy for Patients with Nonvalvular Atrial Fibrillation: Korean Heart Rhythm Society. Korean Circ J. 2015;45:9–19. doi: 10.4070/kcj.2015.45.1.9. [DOI] [PMC free article] [PubMed] [Google Scholar]
- 4.Miyasaka Y, et al. Secular trends in incidence of atrial fibrillation in Olmsted County, Minnesota, 1980 to 2000, and implications on the projections for future prevalence. Circulation. 2006;114:119–125. doi: 10.1161/CIRCULATIONAHA.105.595140. [DOI] [PubMed] [Google Scholar]
- 5.Krijthe BP, et al. Projections on the number of individuals with atrial fibrillation in the European Union, from 2000 to 2060. Eur Heart J. 2013;34:2746–2751. doi: 10.1093/eurheartj/eht280. [DOI] [PMC free article] [PubMed] [Google Scholar]
- 6.Agrawal V, Marinescu V, Agarwal M, McCullough PA. Cardiovascular implications of proteinuria: an indicator of chronic kidney disease. Nat Rev Cardiol. 2009;6:301–311. doi: 10.1038/nrcardio.2009.11. [DOI] [PubMed] [Google Scholar]
- 7.Hemmelgarn BR, et al. Relation between kidney function, proteinuria, and adverse outcomes. JAMA. 2010;303:423–429. doi: 10.1001/jama.2010.39. [DOI] [PubMed] [Google Scholar]
- 8.Bello AK, et al. Associations among estimated glomerular filtration rate, proteinuria, and adverse cardiovascular outcomes. Clin J Am Soc Nephrol. 2011;6:1418–1426. doi: 10.2215/CJN.09741110. [DOI] [PMC free article] [PubMed] [Google Scholar]
- 9.Perkovic V, et al. The relationship between proteinuria and coronary risk: a systematic review and meta-analysis. PLoS Med. 2008;5:e207. doi: 10.1371/journal.pmed.0050207. [DOI] [PMC free article] [PubMed] [Google Scholar]
- 10.Schnabel RB, et al. Relations of biomarkers of distinct pathophysiological pathways and atrial fibrillation incidence in the community. Circulation. 2010;121:200–207. doi: 10.1161/CIRCULATIONAHA.109.882241. [DOI] [PMC free article] [PubMed] [Google Scholar]
- 11.Alonso A, et al. Chronic kidney disease is associated with the incidence of atrial fibrillation: the Atherosclerosis Risk in Communities (ARIC) study. Circulation. 2011;123:2946–2953. doi: 10.1161/CIRCULATIONAHA.111.020982. [DOI] [PMC free article] [PubMed] [Google Scholar]
- 12.White SL, et al. Diagnostic accuracy of urine dipsticks for detection of albuminuria in the general community. Am J Kidney Dis. 2011;58:19–28. doi: 10.1053/j.ajkd.2010.12.026. [DOI] [PubMed] [Google Scholar]
- 13.Lim D, et al. Diagnostic accuracy of urine dipstick for proteinuria in older outpatients. Kidney Res Clin Pract. 2014;33:199–203. doi: 10.1016/j.krcp.2014.10.003. [DOI] [PMC free article] [PubMed] [Google Scholar]
- 14.Son MK, Lim NK, Cho MC, Park HY. Incidence and Risk Factors for Atrial Fibrillation in Korea: the National Health Insurance Service Database (2002–2010) Korean Circ J. 2016;46:515–521. doi: 10.4070/kcj.2016.46.4.515. [DOI] [PMC free article] [PubMed] [Google Scholar]
- 15.Kang SH, et al. Underweight is a risk factor for atrial fibrillation: A nationwide population-based study. Int J Cardiol. 2016;215:449–456. doi: 10.1016/j.ijcard.2016.04.036. [DOI] [PubMed] [Google Scholar]
- 16.Lee SR, Choi EK, Han KD, Cha MJ, Oh S. Trends in the incidence and prevalence of atrial fibrillation and estimated thromboembolic risk using the CHA2DS2-VASc score in the entire Korean population. Int J Cardiol. 2017 doi: 10.1016/j.ijcard.2017.02.039. [DOI] [PubMed] [Google Scholar]
- 17.Lee SR, et al. Evaluation of the association between diabetic retinopathy and the incidence of atrial fibrillation: A nationwide population-based study. Int J Cardiol. 2016;223:953–957. doi: 10.1016/j.ijcard.2016.08.296. [DOI] [PubMed] [Google Scholar]
- 18.Hillege HL, et al. Microalbuminuria is common, also in a nondiabetic, nonhypertensive population, and an independent indicator of cardiovascular risk factors and cardiovascular morbidity. J Intern Med. 2001;249:519–526. doi: 10.1046/j.1365-2796.2001.00833.x. [DOI] [PubMed] [Google Scholar]
- 19.Deckert T, Feldt-Rasmussen B, Borch-Johnsen K, Jensen T, Kofoed-Enevoldsen A. Albuminuria reflects widespread vascular damage. The Steno hypothesis. Diabetologia. 1989;32:219–226. doi: 10.1007/BF00285287. [DOI] [PubMed] [Google Scholar]
- 20.Paisley KE, et al. Endothelial dysfunction and inflammation in asymptomatic proteinuria. Kidney Int. 2003;63:624–633. doi: 10.1046/j.1523-1755.2003.00768.x. [DOI] [PubMed] [Google Scholar]
- 21.Verdecchia P, et al. Atrial fibrillation in hypertension: predictors and outcome. Hypertension. 2003;41:218–223. doi: 10.1161/01.HYP.0000052830.02773.E4. [DOI] [PubMed] [Google Scholar]
- 22.Nichols GA, Reinier K, Chugh SS. Independent contribution of diabetes to increased prevalence and incidence of atrial fibrillation. Diabetes Care. 2009;32:1851–1856. doi: 10.2337/dc09-0939. [DOI] [PMC free article] [PubMed] [Google Scholar]
- 23.Guo Y, Lip GY, Apostolakis S. Inflammation in atrial fibrillation. J Am Coll Cardiol. 2012;60:2263–2270. doi: 10.1016/j.jacc.2012.04.063. [DOI] [PubMed] [Google Scholar]
- 24.McManus DD, Corteville DC, Shlipak MG, Whooley MA, Ix JH. Relation of kidney function and albuminuria with atrial fibrillation (from the Heart and Soul Study) Am J Cardiol. 2009;104:1551–1555. doi: 10.1016/j.amjcard.2009.07.026. [DOI] [PMC free article] [PubMed] [Google Scholar]
- 25.Ohyama Y, Imai M, Kurabayashi M. Estimated glomerular filtration rate and proteinuria are separately and independently associated with the prevalence of atrial fibrillation in general population. PLoS One. 2013;8:e79717. doi: 10.1371/journal.pone.0079717. [DOI] [PMC free article] [PubMed] [Google Scholar]
- 26.Marcos EG, et al. Relation of renal dysfunction with incident atrial fibrillation and cardiovascular morbidity and mortality: The PREVEND study. Europace. 2017 doi: 10.1093/europace/euw373. [DOI] [PubMed] [Google Scholar]
- 27.National Kidney, F. K/DOQI clinical practice guidelines for chronic kidney disease: evaluation, classification, and stratification. Am J Kidney Dis. 2002;39:S1–266. [PubMed] [Google Scholar]
- 28.Samal L, Linder JA. The primary care perspective on routine urine dipstick screening to identify patients with albuminuria. Clin J Am Soc Nephrol. 2013;8:131–135. doi: 10.2215/CJN.12681211. [DOI] [PubMed] [Google Scholar]
- 29.Simerville JA, Maxted WC, Pahira JJ. Urinalysis: a comprehensive review. Am Fam Physician. 2005;71:1153–1162. [PubMed] [Google Scholar]
- 30.Powe NR, Boulware LE. Population-based screening for CKD. Am J Kidney Dis. 2009;53:S64–70. doi: 10.1053/j.ajkd.2008.07.050. [DOI] [PMC free article] [PubMed] [Google Scholar]
- 31.Kondo M, et al. Cost-effectiveness of chronic kidney disease mass screening test in Japan. Clin Exp Nephrol. 2012;16:279–291. doi: 10.1007/s10157-011-0567-1. [DOI] [PMC free article] [PubMed] [Google Scholar]
- 32.Sarnak MJ, et al. Kidney disease as a risk factor for development of cardiovascular disease: a statement from the American Heart Association Councils on Kidney in Cardiovascular Disease, High Blood Pressure Research, Clinical Cardiology, and Epidemiology and Prevention. Circulation. 2003;108:2154–2169. doi: 10.1161/01.CIR.0000095676.90936.80. [DOI] [PubMed] [Google Scholar]
- 33.Astor BC, Coresh J, Heiss G, Pettitt D, Sarnak MJ. Kidney function and anemia as risk factors for coronary heart disease and mortality: the Atherosclerosis Risk in Communities (ARIC) Study. Am Heart J. 2006;151:492–500. doi: 10.1016/j.ahj.2005.03.055. [DOI] [PubMed] [Google Scholar]
- 34.Kottgen A, et al. Reduced kidney function as a risk factor for incident heart failure: the atherosclerosis risk in communities (ARIC) study. J Am Soc Nephrol. 2007;18:1307–1315. doi: 10.1681/ASN.2006101159. [DOI] [PubMed] [Google Scholar]
- 35.Eisen A, et al. Estimated glomerular filtration rate within the normal or mildly impaired range and incident non-valvular atrial fibrillation: Results from a population-based cohort study. Eur J Prev Cardiol. 2017;24:213–222. doi: 10.1177/2047487316676132. [DOI] [PubMed] [Google Scholar]
- 36.de Zeeuw D, et al. Albuminuria, a therapeutic target for cardiovascular protection in type 2 diabetic patients with nephropathy. Circulation. 2004;110:921–927. doi: 10.1161/01.CIR.0000139860.33974.28. [DOI] [PubMed] [Google Scholar]
- 37.Strickberger SA, et al. Relationship between atrial tachyarrhythmias and symptoms. Heart Rhythm. 2005;2:125–131. doi: 10.1016/j.hrthm.2004.10.042. [DOI] [PubMed] [Google Scholar]
- 38.Sanna T, et al. Cryptogenic stroke and underlying atrial fibrillation. N Engl J Med. 2014;370:2478–2486. doi: 10.1056/NEJMoa1313600. [DOI] [PubMed] [Google Scholar]
- 39.Clarke R, et al. Underestimation of risk associations due to regression dilution in longterm follow-up of prospective studies. Am J Epidemiol. 1999;150:341–353. doi: 10.1093/oxfordjournals.aje.a010013. [DOI] [PubMed] [Google Scholar]
- 40.Hutcheon JA, Chiolero A, Hanley JA. Random measurement error and regression dilution bias. BMJ. 2010;340:c2289. doi: 10.1136/bmj.c2289. [DOI] [PubMed] [Google Scholar]
- 41.Jafar TH, et al. Proteinuria as a modifiable risk factor for the progression of non-diabetic renal disease. Kidney Int. 2001;60:1131–1140. doi: 10.1046/j.1523-1755.2001.0600031131.x. [DOI] [PubMed] [Google Scholar]
- 42.Zhang Y, et al. The role of renin-angiotensin system blockade therapy in the prevention of atrial fibrillation: a meta-analysis of randomized controlled trials. Clin Pharmacol Ther. 2010;88:521–531. doi: 10.1038/clpt.2010.123. [DOI] [PubMed] [Google Scholar]
Associated Data
This section collects any data citations, data availability statements, or supplementary materials included in this article.