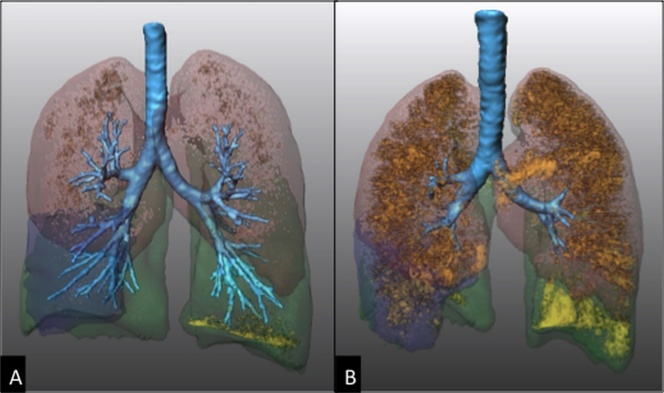
Figure 5. Post-processing imaging techniques: quantification of emphysema and air-trapping.
Quantification in a 73 years-old woman with COPD by using dedicated software of semi-automatic lung volume segmentation (Franhofer MeVis, Germany, DE). Volume rendering CT images at end-inspiration (A) and end-expiration (B) show pulmonary lobes with different colours and low attenuation areas as orange dots. At end-inspiration (A) the dots represent areas with attenuation values below -950 HU consistent with emphysema, whereas at end-expiration (B) the dots represent areas with attenuation values below -856 HU, consistent with air-trapping and emphysema.

