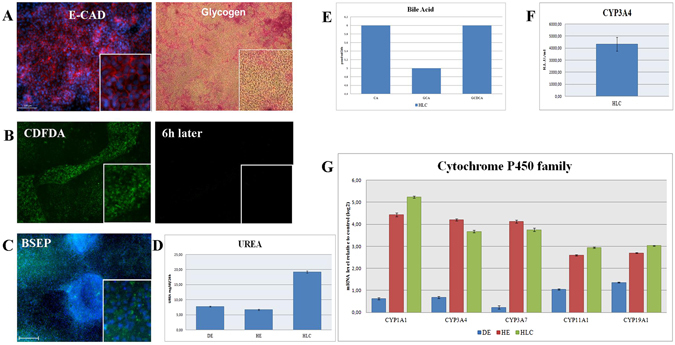
Figure 2.

Functional analysis of hepatocyte-like cells (HLCs) derived from E-iPSCs. (A) E-Cadherin (E-CAD) antibody staining marking cell shape (left panel), Glycogen storage (right panel), Periodic Acid-Schiff (PAS) assay was used. Glycogen storage is indicated by pink or dark red-purple cytoplasm. (B) Visualization of 5 (and 6)-Carboxy-2′,7′-dichlorofluorescein diacetate (CDFDA), immunofluorescence image of HLCs direct after incubation with CDFDA (left panel), and immunofluorescence image of HLCs six hours later (right panel). (C) Immunofluorescence-based protein staining of bile salt export pump (BSEP). (D) Analysis of UREA production in E-iPSC-DE (DE), E-iPSC-HE (HE) and E-iPSC-HLCs (HLC). Three biological replicates in technical triplicates of each sample were analyzed. The levels of urea are presented as a percentage, considering measured levels of urea in mg/dL/24 h. The error bars indicate the standard errors of the mean. (E) Measurement of bile acid secretion of E-iPSC-HLCs (HLC). (F) Measurement of CYP3A4 secretion of HLC samples. Three biological replicates in technical triplicates were analyzed. The levels of CYP3A4 are presented as relative light units per milliliter (R.L.U./ml). The error bars indicate the standard errors of the mean. (G) Quantitative real-time PCR (qPCR) analysis of cytochrome P450 family member activity of all stages E-iPSC-DE (DE), E-iPSC-HE (HE) and E-iPSC-HLC (HLC) are shown. Three biological replicates in technical triplicates of each sample were analyzed. The data were normalized to E-iPSCs. The standard deviation is depicted by the error bars.
