Figure 3.

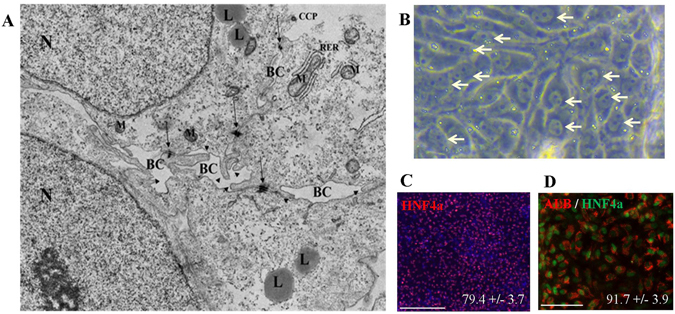
Ultra structure and maturation. (A) Electron microscopy image of E-iPSC-HLCs. BC = bile canaliculi; L = lipid; CCP = clathrin coated pits; M = mitochondrion; RER = rough endoplasmic reticulum; N = nucleus; arrow = tight junctions; arrowhead = microvilli. (B) Bright field microscopy of HLCs. Bi-nuleated cells are marked by arrow-heads. (C) Immunofluorescence-based staining of HNF4α in end-stage HLCs. 79.4% (+/−3.7%) of the cells counted positive for HNF4α. Scale bar: 200 μm Alexa Flour 594 (red). (D) Immunofluorescence-based double staining of Albumin (ALB) and HNF4α in end-stage HLCs. 91.7% (+/− 3.9) of HNF4α positive cells were also positive for ALB. Scale bar: 100 μm, Alexa Flour 594 (red) and Alexa Flour 488 (green).
