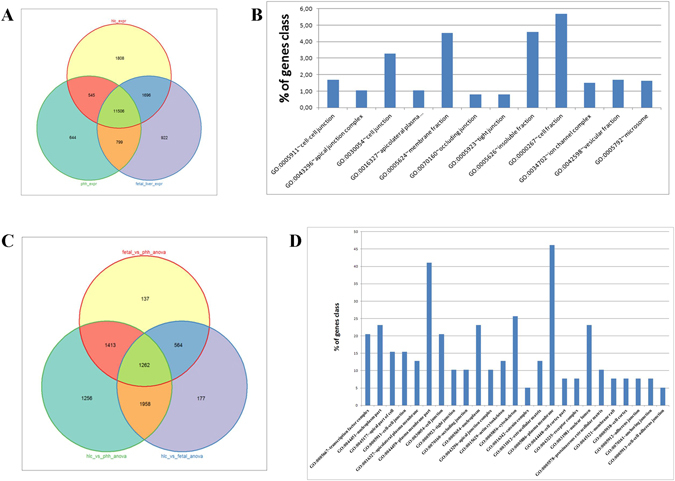
Figure 5.

Comparative transcriptome profile analyses. (A) Venn diagram of HLCs, fetal liver and PHH. (B) GO cellular components of HLC exclusively expressed genes (Fisher extract p < 0.01). (C) Venn diagram of fetal liver vs. PHH anova, HLC vs. fetal liver anova and HLC vs. PHH anova. (D) GO cellular components of HIPPO pathway genes exclusively expressed genes (Fisher extract p < 0.01) in the intersection of HLC vs. fetal liver anova and HLC vs. PHH anova (intersection with 1958 genes).
