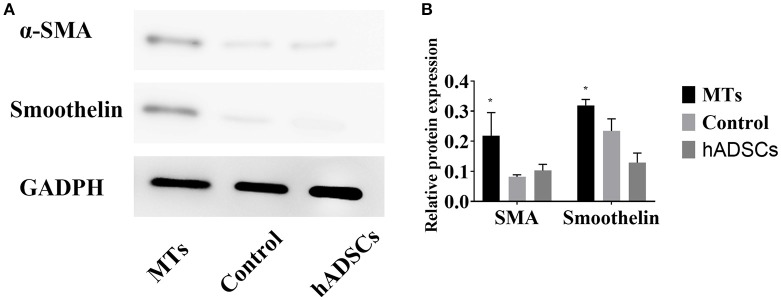
Figure 5.
(A) western blotting compared the relative protein expression of α-SMA and smoothelin in microtissues (MTs) and induced monolayer cultured hADSCs (control) and non-induced hADSCs (hADSCs); (B) Semi-quantitative data of relative protein expression (target protein/GADPH). *P < 0.05 vs. the control and hADSCs.

