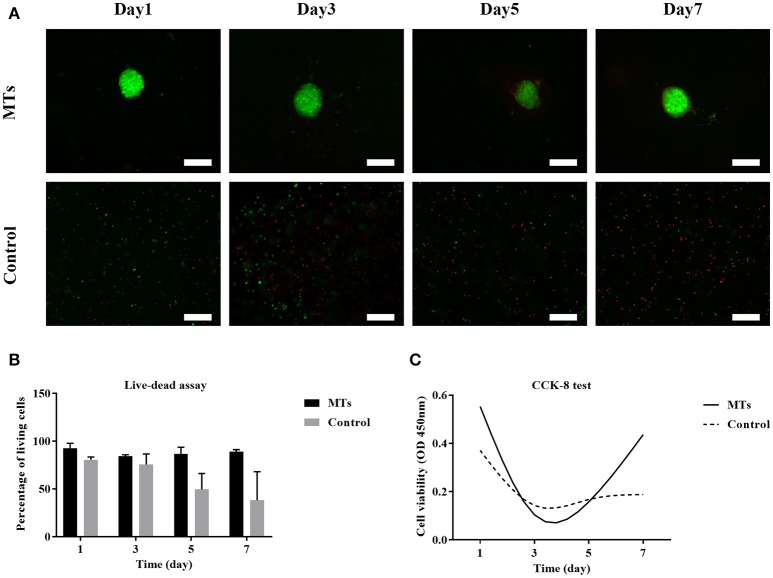
Figure 8.
Live-dead assay of MTs and the control group bioprinted in the 3D structure (A). Fluorescence image showed live cells (green) and dead cells (red), inset bar = 100 μm. The quantitative data of cell viability at different time points in the bioprinted 3D structure (B). CCK-8 test to detect the proliferation of MTs and the control group in the bioprinted 3D structure (C).

