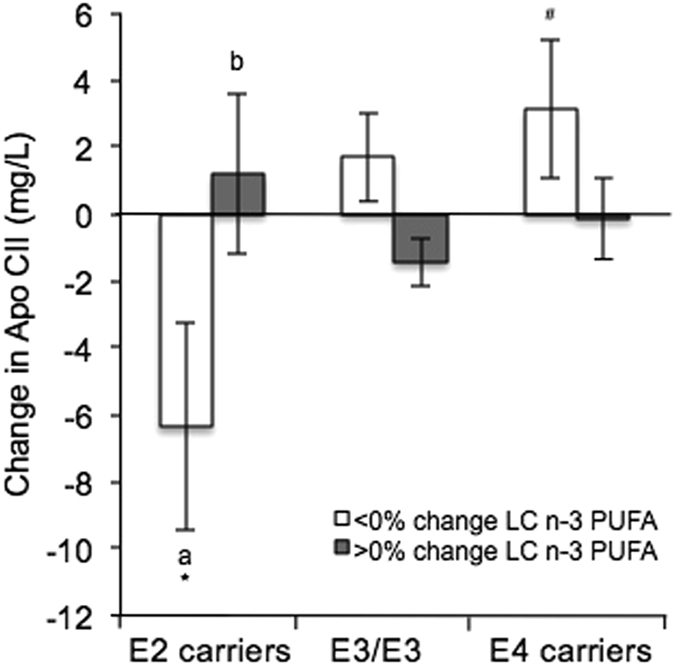
Figure 2.

Effect of the APOE genotype and change in plasma LC n-3 PUFA concentration on change in apo CII (APOE × LC n-3 PUFA interaction, P = 0.041) following the LIPGENE Dietary Fatty Acid Intervention in metabolic syndrome subjects. Values are means ± s.e.m. Letters (a and b) are used to denote significant differences between plasma fatty acid groups within the same genotype; symbols (* and #) are used to denote significant differences between genotypes within the same fatty acid group, P < 0.05 using post hoc Bonferroni.
