FIGURE 2.

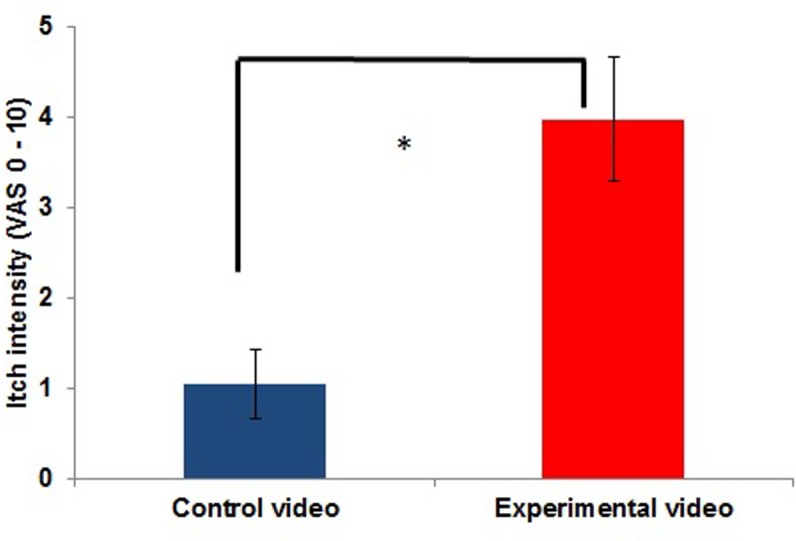
Itch intensity inside the scanner during the control condition (presentation of a CV) compared to itch during the experimental condition (CI condition: presentation of a video showing other people scratching; EV; n = 11; ∗p < 0.05).

Itch intensity inside the scanner during the control condition (presentation of a CV) compared to itch during the experimental condition (CI condition: presentation of a video showing other people scratching; EV; n = 11; ∗p < 0.05).