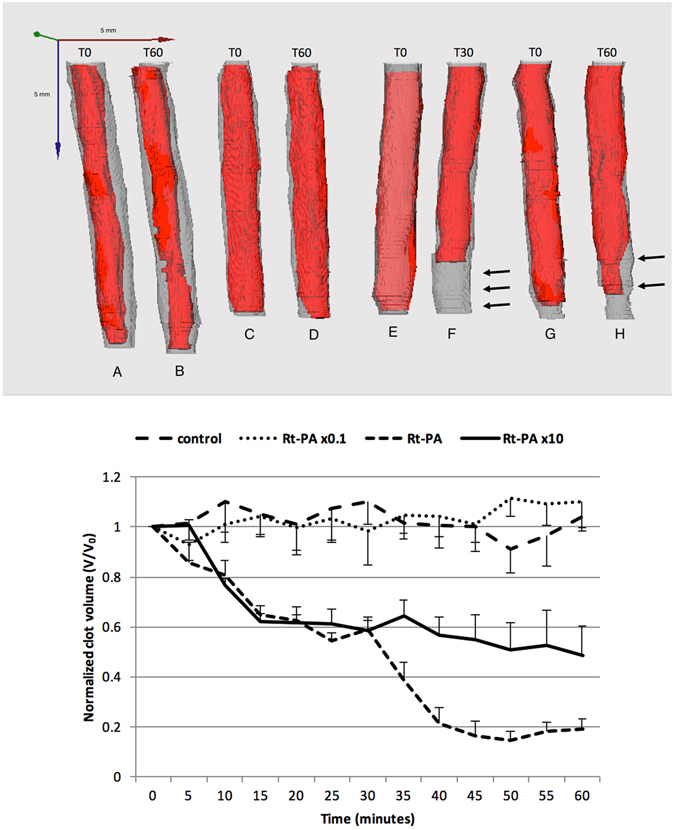
Figure 4.

Thrombolytic efficacy of in vitro after Rt-PA delivery in the stenosis model. Blood clots were treated with a range of Rt-PA alone in a range of concentrations (0, 0.3, 3, 30 µg/ml). The blood clot volume was assessed every 5 min for 60 min using high frequency ultrasound imaging. 3D reconstruction of clots was performed at T0 and T60 (Top), except for the Rt-PA condition (T30) as the clot was almost lysed at T60. A, B Rt-PA x0,1; C-D: control; E-F: Rt-PA; G-H: Rt-PAx10 (Arrows indicating the lysis of the clot). Video 1 is showing the clot volume at T0 and T30 in the Rt-PA condition. Data expressed as mean ± SEM were calculated from four independent experiments (Bottom).
