
Figure 2.
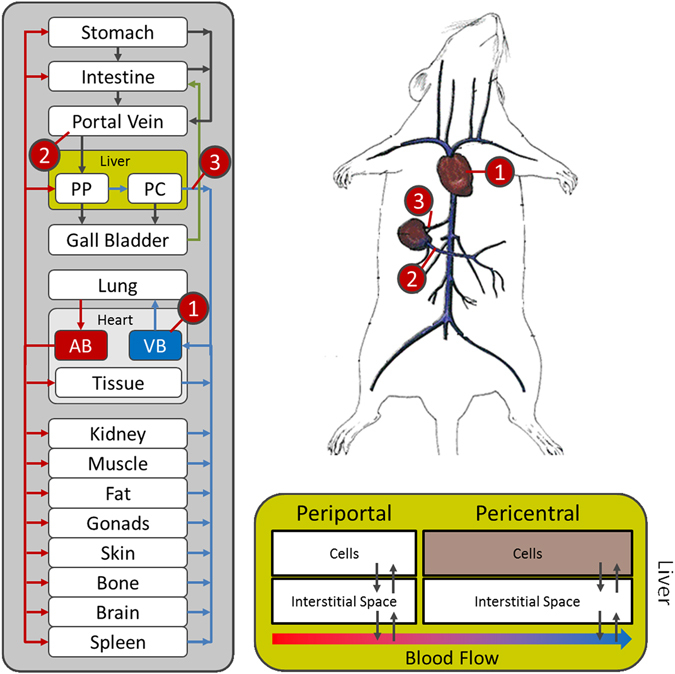
PBPK modelling in mice. Plasma concentration profiles from three different sampling sites where used in this study: the right heart chamber (1) and the portal vein (2) (both contributing to the liver inflow) and the hepatic vein (3) (representing the liver outflow). Due to the detailed structure of PBPK-models (left), it was possible to include all three sampling sites into the model at the same time (upper right). The volume fractions of the periportal and the pericentral zone of the liver lobule (lower right) were set according to the previously determined fractions of expression (Table 1).